Tropical Storm Hanna on its Way to South Texas; Monsoonal Flow Kicking In; and the Status of Soil Moisture

Tropical Storm Hanna on its Way to South Texas; Monsoonal Flow Kicking In; and the Status of Soil Moisture

As of this writing, Tropical Storm Hanna is expected to bring tropical-storm-force winds this morning (Saturday, July 25th) to parts of the Texas coast. Rainfall associated with Hanna could result in flash flooding across South Texas today and into Sunday. The below map show the 1-3 Day expected rainfall totals from Hanna.  Note parts of South Texas could see totals of 10″ or more.

Flash flooding is also possible across the Southwest into Southern and Central Rockies, as well as the Central Plains into the Midwest over the next two days.  We are starting to see some monsoonal flow coming off the eastern Pacific, which could drastically help the ongoing drought in the Southwest and Colorado.


The full 10-day accumulated precipitation forecast using NOAA’s GFS model is below.  While we are likely to see some fairly large flooding impacts from Hanna, other parts of the country in drought should see some improvement over the next several days.  The hardest hit areas in the Southwest and Colorado, though, are in some pretty large precipitation deficits so there is a lot of ground to make up.

Soil Moisture Status

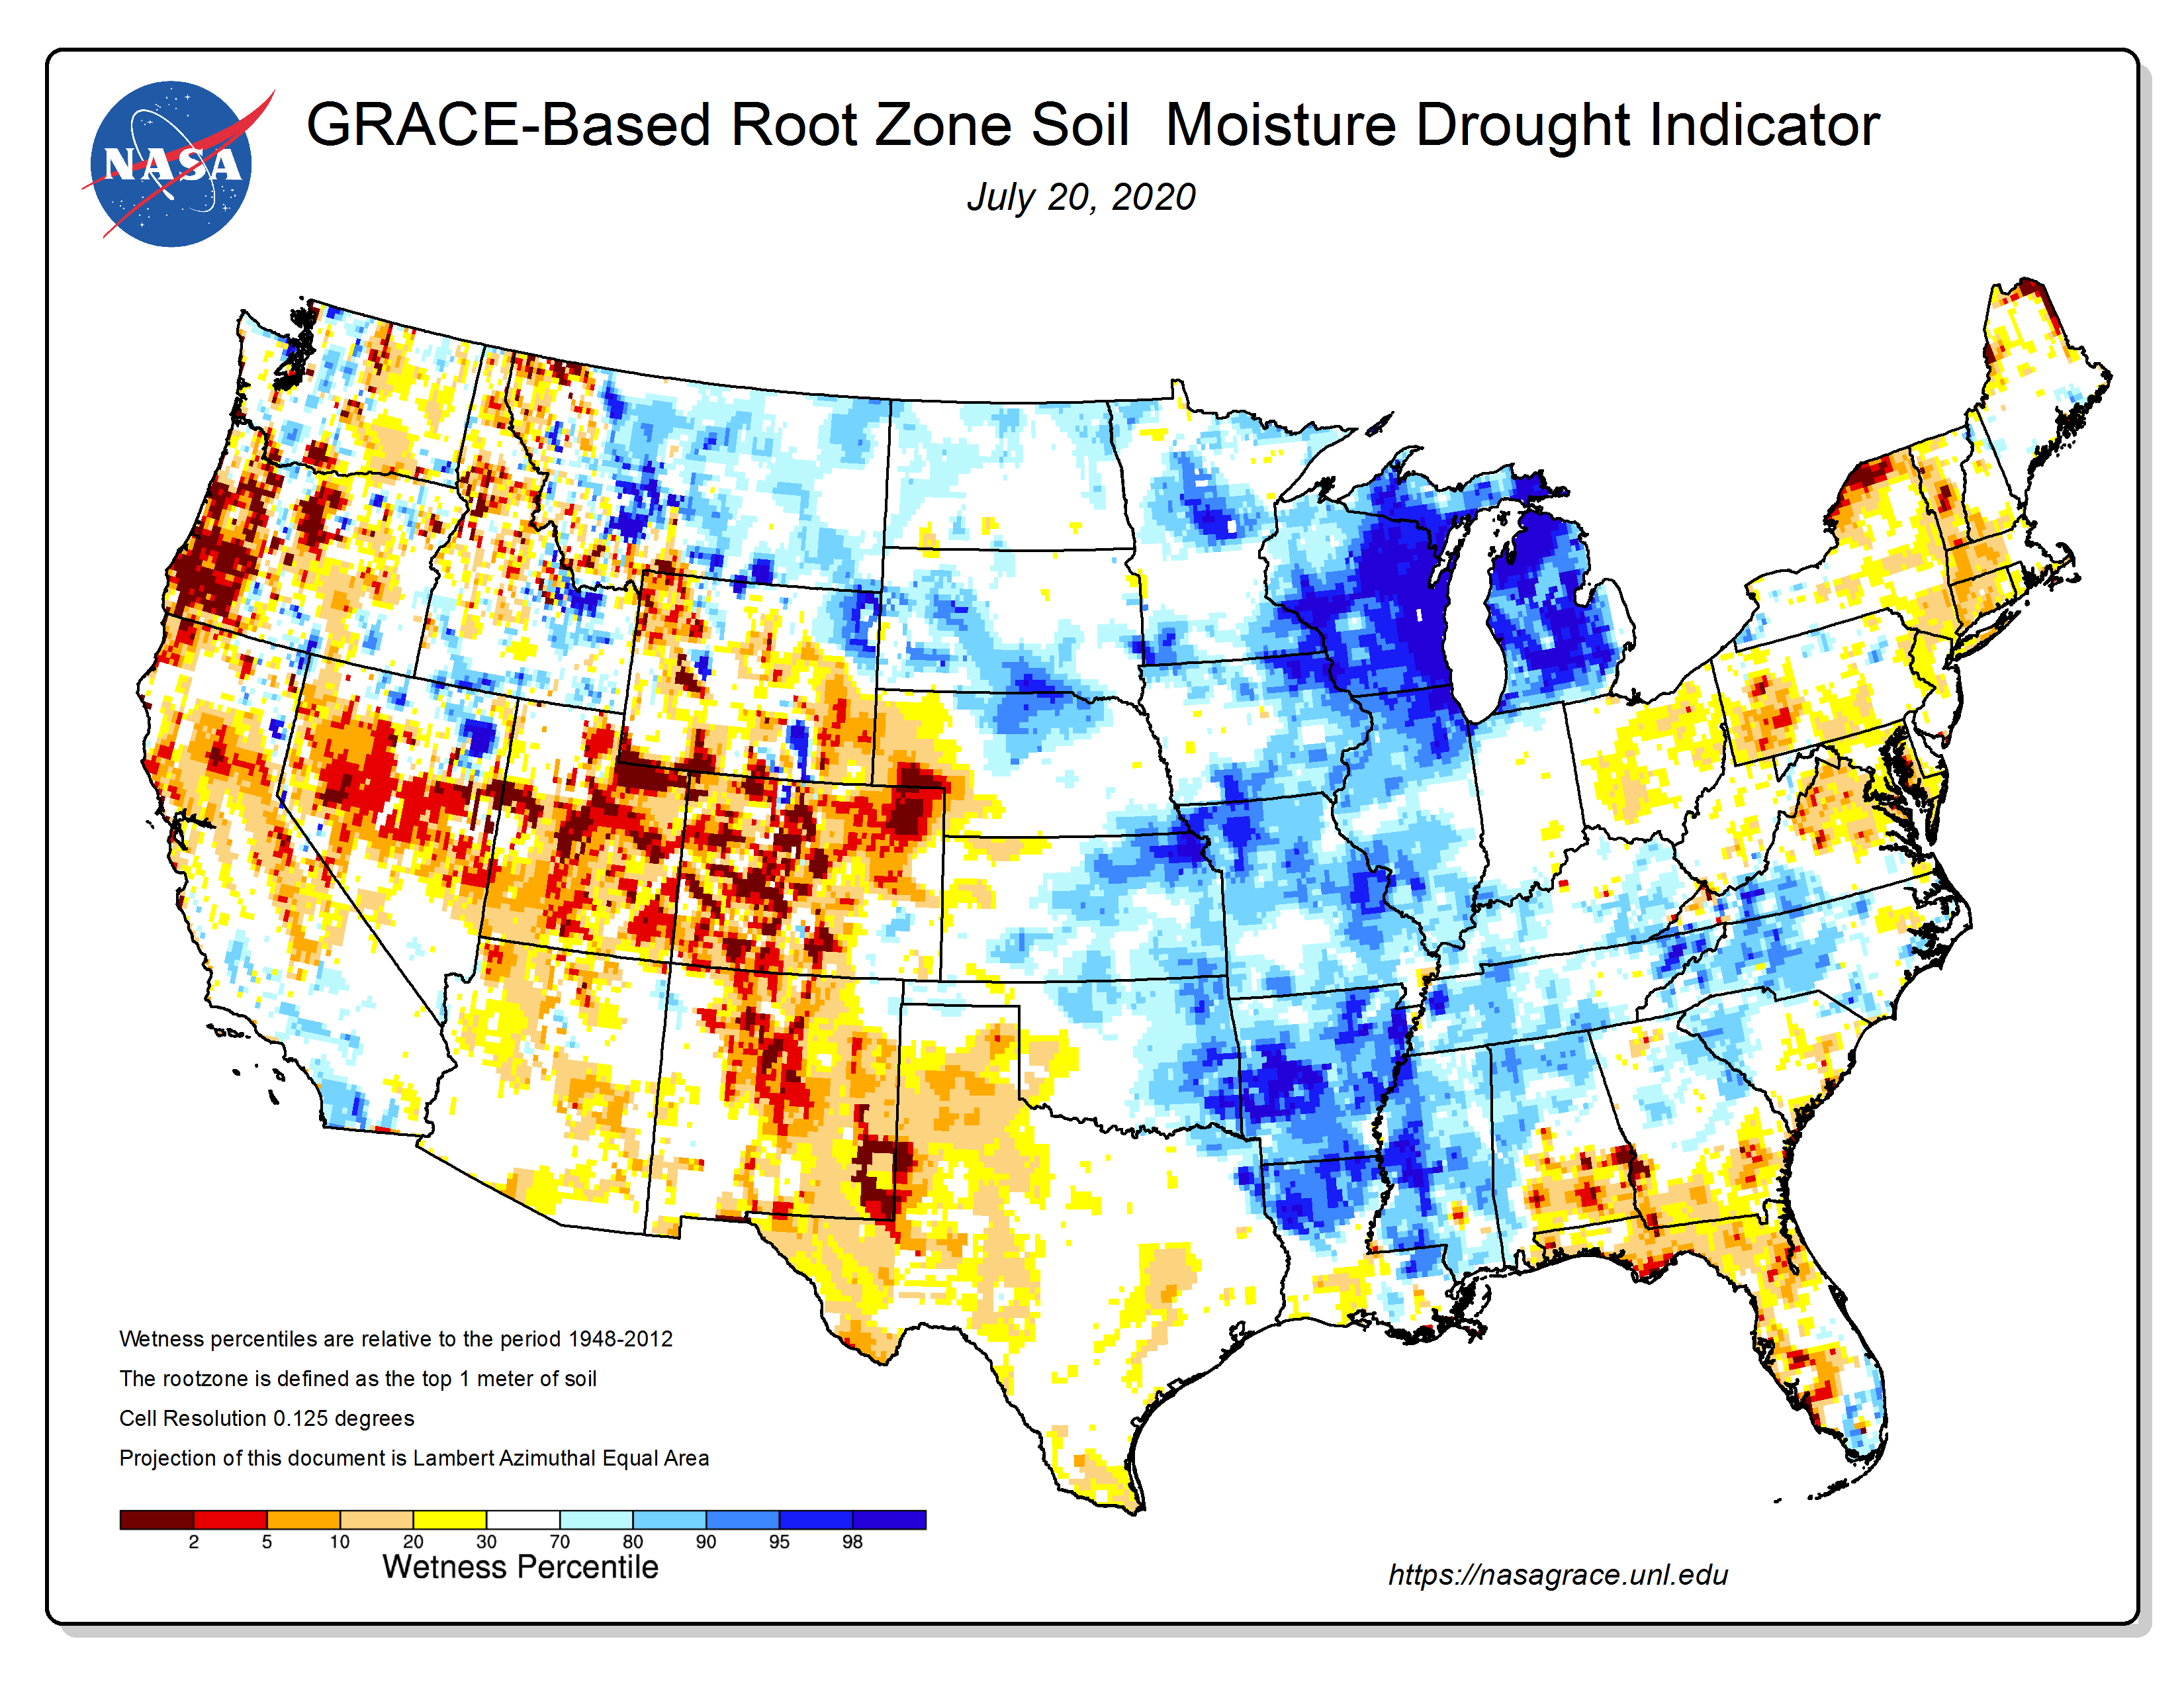
The below maps shows the status of surface and root zone soil moisture based on the NASA GRACE satellite.  This NASA product is one of the newer drought indicators being used for the U.S. Drought Monitor.  Note the colors indicate dry/wet percentiles, which is basically the frequency a given area has been dry/wet.  Note areas in Texas, Southwest, and Intermountain West are seeing soil moisture conditions in the 5th percentile or less.

Surface Soil Moisture

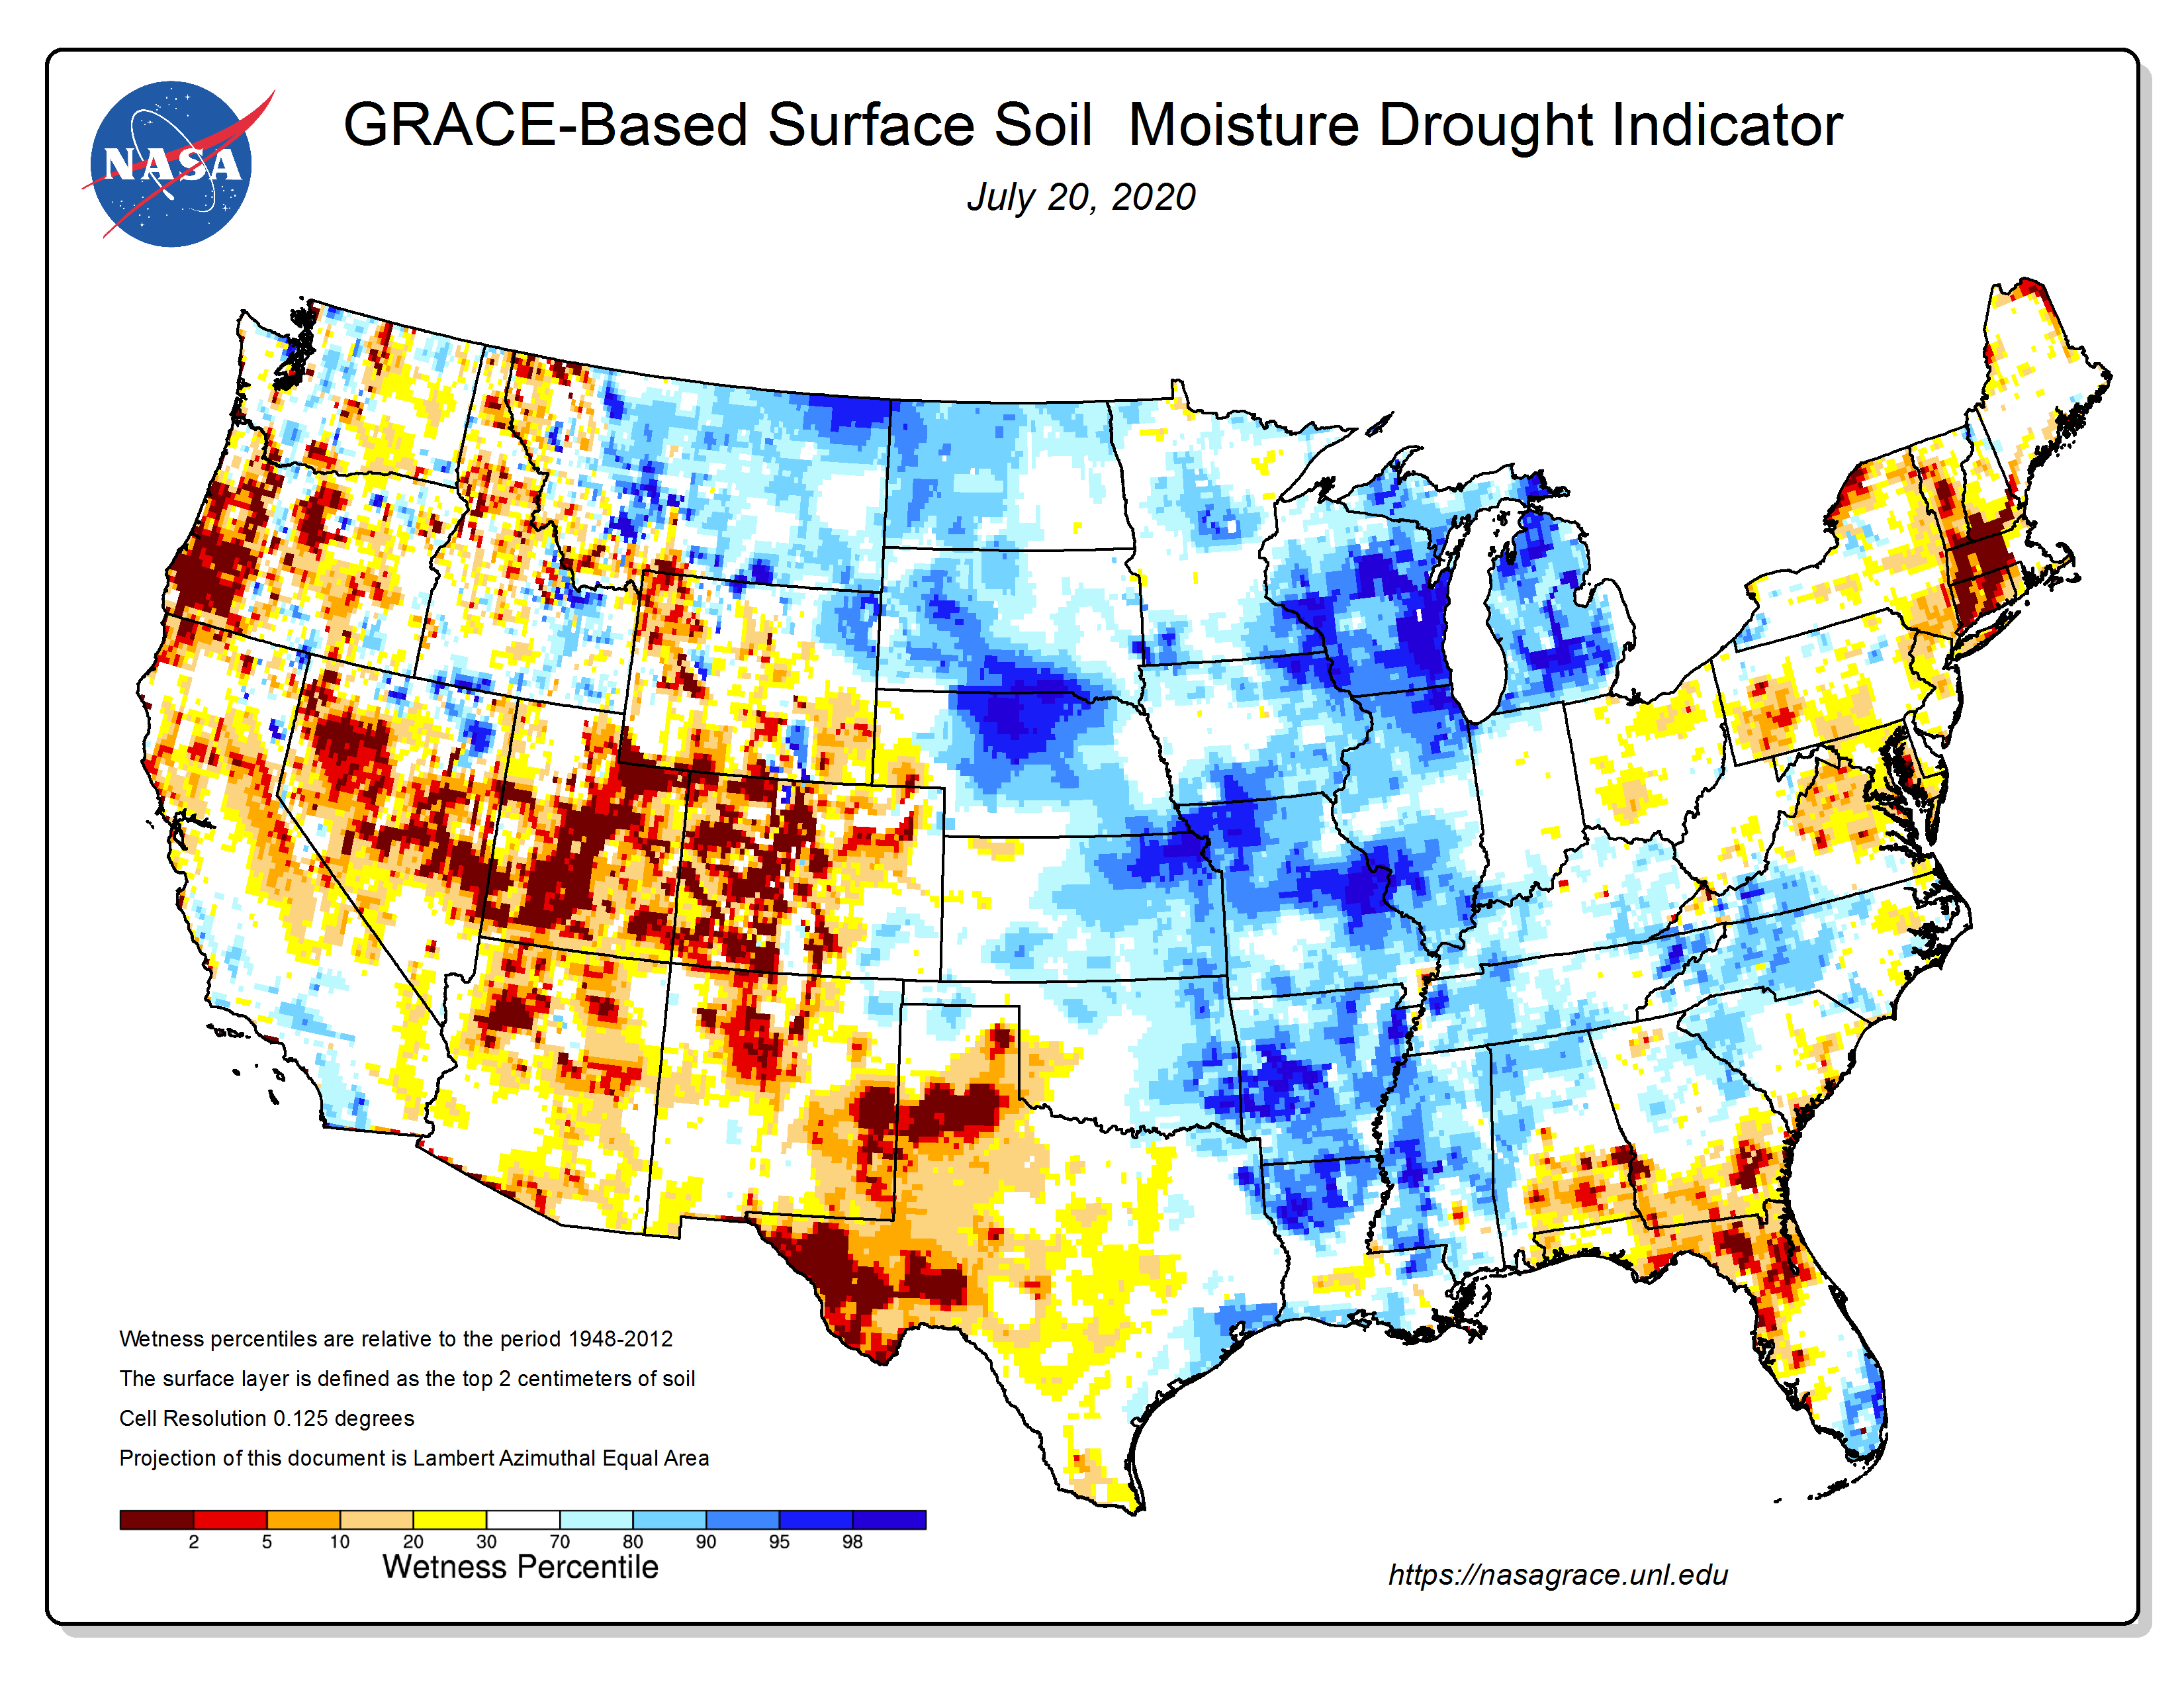
Root Zone Soil Moisture

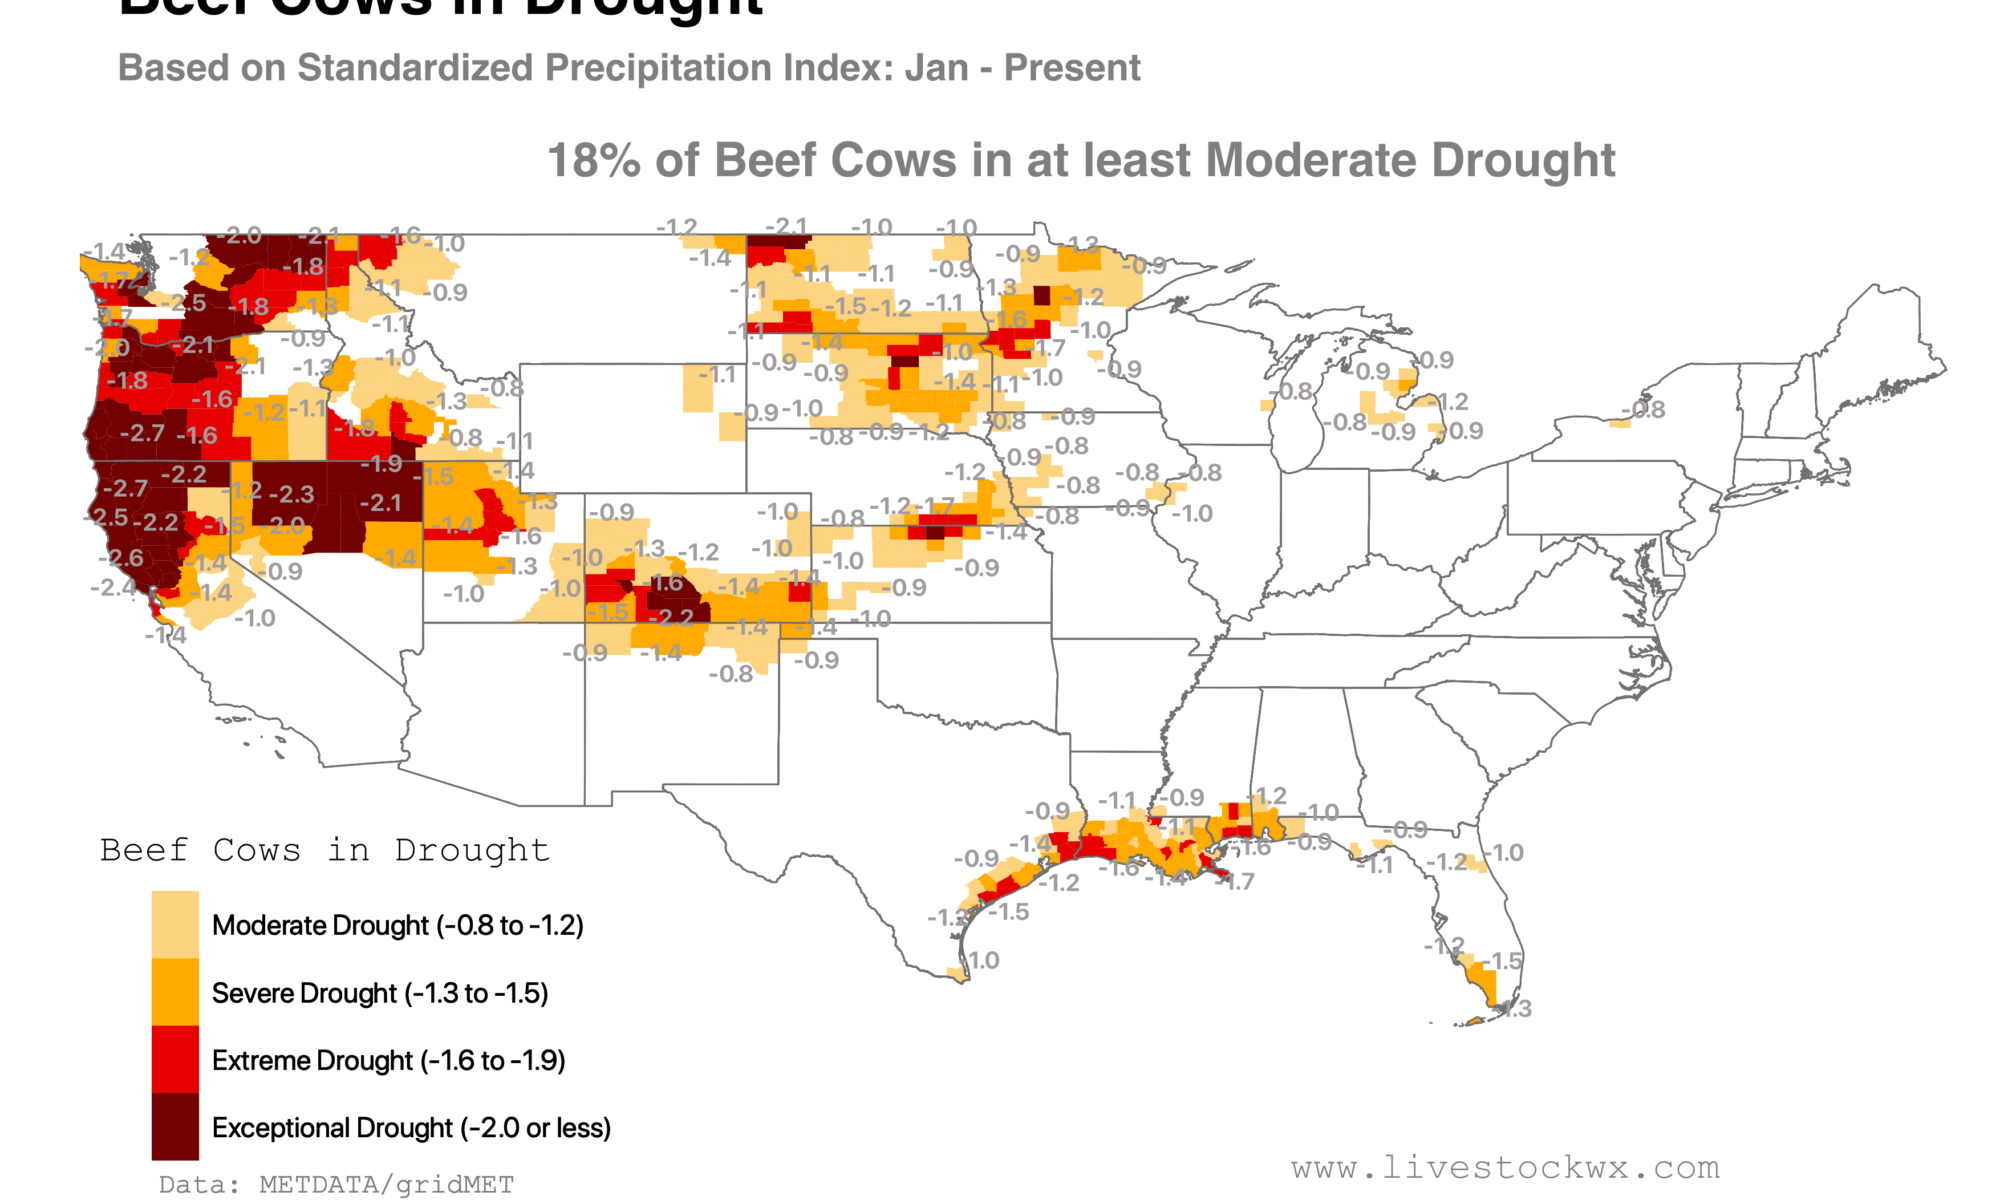
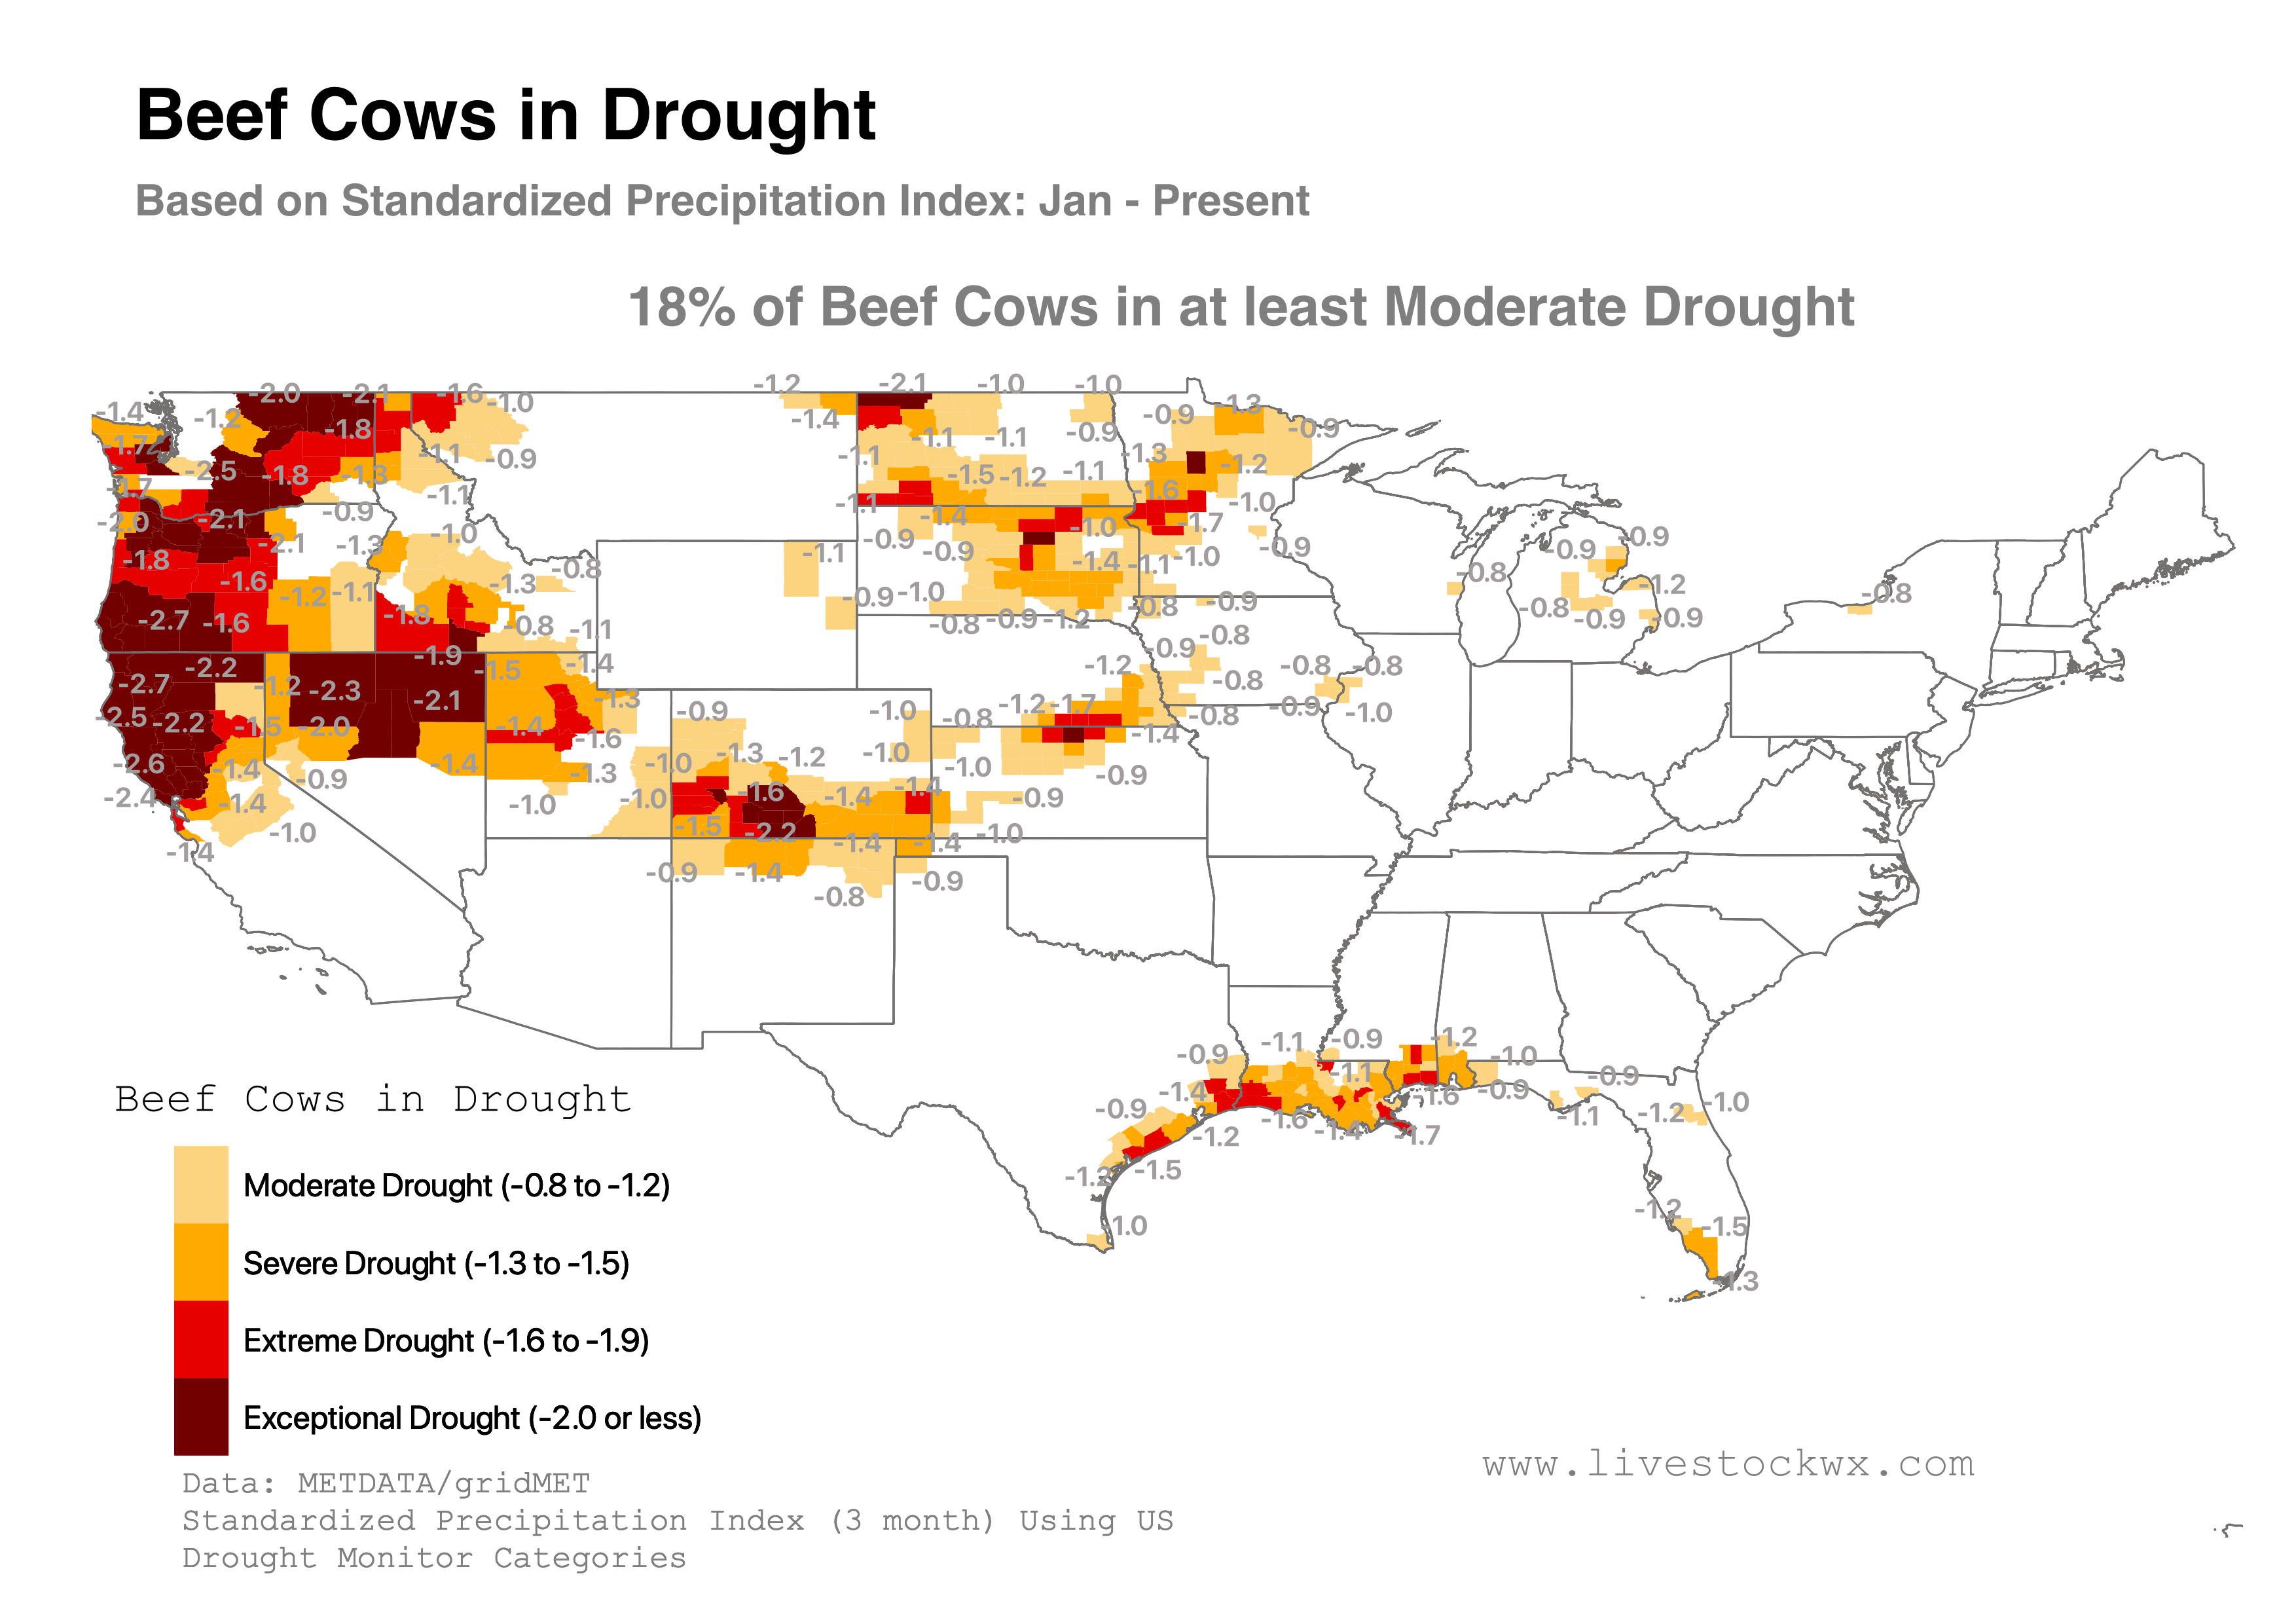
Cattle, Corn, and Hay in Drought

For those interested in the percentage of cattle, corn, and hay in drought take a look at the below chart.  This goes back to 2011 when USDA started tracking the percentage of ag in drought.  Hopefully this will put things in some context, or at least help us be thankful it’s not 2012!

Aug-Sep-Oct Seasonal Outlooks from the North American Multi-Model Ensemble and Evaporative Demand Forecast

Aug-Sep-Oct Seasonal Outlooks from the North American Multi-Model Ensemble and Evaporative Demand Forecast

Note: The North American Multi-Model Ensemble (NMME) is an experimental multi-model seasonal forecasting system consisting of forecast models from several US modeling centers along with Canada's Meteorological Centre.

The latest outlooks for temperature and precipitation were released from the North American Multi-Model Ensemble this week.  The Outlooks include the monthly forecast for August as well as the seasonal forecast for Aug-Sep-Oct.

This month we also have included an evaporative demand forecast that is being produced by NOAA’s Physical Sciences Center.  The forecast is part of a relatively new drought index called the Evaporative Demand Drought Index (EDDI-pronounced Eddie).  The EDDI assesses how much pressure the atmosphere is applying to moisture and thus moving it out of plants and the soil.

More recently EDDI was expanded to include a forecast.  The reason this is interesting is that EDDI is good at tracking drought but does not directly measure precipitation.  It only measures temperature, solar intensity, humidity, and wind speed.  As most people know, forecasting precipitation, especially in the summer, is extremely difficult.  Forecasting the components of EDDI, though, is something we are actually relatively good at and in a way gets around relying on a precipitation forecast. We have included below the EDDI forecast starting in July and going all the way into December.  Probably not a good idea to look too carefully at what could happen in December, but the next three months is fair game and not a stretch for the CFS forecast model EDDI is using. 

It surprised us somewhat they are not expecting to not see much drying outside of July.  When compared below to the NMME model output for August and the Aug-Sep-Oct, we see this is somewhat supported by the multi model ensemble from the NMME.

Now, back to the NMME model output.  The monthly outlook maps are below.  For temperature, a warmer than normal August is expected for a large part of the country.  The odds are strongest for the Plains/Southwest/West.

August precipitation is less clear, although, we see some enhanced odds in parts of Oklahoma, Texas, the Northern Plains and the Southeast.

August Temperature Outlook

August Precipitation Outlook

Aug-Sep-Oct Season

Somewhat similar to expectations for August, the Seasonal Outlook shows enhanced odds of a warmer than normal Aug-Sep-Oct.  The odds are highest in parts of the Southwest and California.

The NMME output for precipitation for Aug-Sep-Oct is showing a tilt in the odds of higher than normal precipitation in the Dakotas and parts of the Southeast.  Below average precipitation could be observed in parts of Colorado, Oklahoma, and Kansas.  The odds are relatively weak, though, and it doesn’t appear there is a strong regional trend among the NMME models for the Central Plains.

Aug-Sep-Oct Temperature Outlook

Aug-Sep-Oct Precipitation Outlook

June Temperature and Precipitations Stats Are Out. Record Driest June in Parts of Southwest, Northeast Oklahoma, and New England

June Temperature and Precipitations Stats Are Out. Record Driest June in Parts of Southwest, Northeast Oklahoma, and New England

The June temperature and precipitation stats are out.  Over the last month temperatures (map immediately below) have been above normal for most of the central part of the Country.  Temperatures were particularly warm, and in the top 10 percentile, along an axis going from Arizona to Minnesota.

For precipitation, parts of the Pacific Northwest, Gulf Coast, and the Upper Midwest observed above normal levels.  Much off cattle country, however, saw less than average totals.  Northeast Oklahoma, parts of North Dakota, and New England observed their driest June on record.  A large part of the Southwest and California also record low precipitation totals.

Drought Status

Unfortunately as is usual in the summer months, drought is centered across the Plains and the Western States (map at right).  At present there is no D4 (Exceptional Drought), the highest drought category the U.S. Drought Monitor has, but there is plenty of D3 (Extreme Drought). 

The second map below shows how drought has changed over the last month.  Yellow/brown colors represent where drought has expanded and or strengthen, while green/blue indicates where drought has improved.  Consistent with the June precipitation trends we see expansion of drought over the last month in Oklahoma, Kansas, and parts of the Oklahoma/Texas Panhandle.  For the Northern Plains, Central Wyoming and western South Dakota have also observed a large expansion/intensification of drought.  Likewise, the Northeast has observed a large part of their region in drought.  Particularly hit hard is Maine.

June-July Change in Drought

Current Topsoil Moisture

To round out the discussion, the above map shows USDA’s estimate of the percentage of topsoil considered short or very short moisture.  Cattle country states trending the wrong way include Texas, Oklahoma, Kansas, Nebraska, Iowa, and Wyoming.

NOAA Releases its Seasonal Outlooks: Hot for Most of the Country through September; Drought Expected to Expand in the West

NOAA Releases its Seasonal Outlooks: Hot for Most of the Country through September; Drought Expected to Expand in the West

Note: The North American Multi-Model Ensemble (NMME) is an experimental multi-model seasonal forecasting system consisting of forecast models from several US modeling centers along with Canada's Meteorological Centre.

Last week we saw the release of the seasonal outlooks from the North American Multi-Model (NMME) Ensemble modeling effort.  This week–like most weeks following the release of the NMME forecasts–NOAA put out their official seasonal outlooks.  The NOAA Outlooks are somewhat anti-climatic, though, since their hand is usually tipped since they also use out from the NMME and you can usually get a good idea what the official outlook will look like a week ahead of time. 

For comparison purposes we’ve included the NMME Jul-Aug-Sep Outlook maps next to the maps Livestock Wx produced using the NOAA official forecast data.

Jul-Aug-Sep NMME Temperature Outlook

Jul-Aug-Sep NOAA Temperature Outlook

The temperature outlook Jul-Aug-Sep predicts fairly strong odds of above normal temperatures for most of the lower 48 states, with the one exception being parts of the Central Mississippi Valley, where there are very little signs of either a warmer or cooler than normal Jul-Aug-Sep.

The Jul-Aug-Sep precipitation outlook indicates a tilt in the odds of above normal precipitation for much of the eastern part of the country starting from parts of the eastern Great Plains.  For much of the Pacific Northwest, the Northern Rockies, and extending southeastward into the Central Rockies, parts of the northern Great Basin, and northeast regions of the Four Corners region there is a tilt in the odds of below normal precipitation over the next three months. Equal chances of below, near and above normal precipitation are indicated for areas of the Southwest CONUS, the western Great Plains, the Upper Mississippi Valley, the Great Lakes region, and the Northeast.

Jul-Aug-Sep NMME Precipitation Outlook

Jul-Aug-Sep NOAA Precipitation Outlook

Jul-Aug-Sep Drought Outlook

Excerpt from Drought Outlook Narrative–Drought coverage rapidly developed and intensified across the southern Great Plains and eastern New Mexico since May (see map below), due to insufficient rainfall, above normal temperatures, and periods of enhanced winds.

Improvement or removal is slightly favored for parts of Oklahoma and northwest Texas due in part to an expected increase in rainfall during the latter half of June. Farther to the west across the Texas Panhandle and eastern New Mexico, that improvement is related to a relatively wet climatology, associated with the Southwest Monsoon. Nearly half of the annual precipitation typically occurs during July-August-September across eastern New Mexico. Drought is likely to persist and expand across the West and northern to central High Plains through the summer. A major factor in the drought expansion is the likelihood of above normal temperatures during the outlook period.

Drought, Beef Cows, and Corn

Drought is not expected to develop across the Corn Belt and Midwest over the next three months, however, it doesn’t mean a shorter-term flash drought could develop given the higher than normal temperatures expected through September.

For beef cows, approximately 18% of the beef cow inventory is currently in drought based on the U.S. Drought Monitor.  Looking back at NOAA’s May-Apr-Jun Seasonal Drought Outlook, around 10% of the beef cow inventory was expected to be in drought by the end of June.  The forecast missed the mark by about eight percentage points.  The reason has to do with the rapidly developing drought in southeast Colorado, the Texas and Oklahoma Panhandle and the more recent drought development in Wyoming and Montana.

Looking at the current Seasonal Drought Outlook, approximately 17% of beef cows are expected to be in drought by the end of September, which is about a one percentage point improvement from our current situation.  The reason for the improvement is due to expected drought improvement in parts of Oklahoma and the Texas’ South/Rolling Plains.

Latest Monthly and Seasonal Outlooks from the North American Multi-Model Ensemble Forecast

Latest Monthly and Seasonal Outlooks from the North American Multi-Model Ensemble Forecast

Note: The North American Multi-Model Ensemble (NMME) is an experimental multi-model seasonal forecasting system consisting of forecast models from several US modeling centers along with Canada's Meteorological Centre.

The latest outlooks for temperature and precipitation were released from the North American Multi-Model Ensemble this week.  The Outlooks include the monthly forecast for July as well as the seasonal forecast for Jul-Aug-Sep.

The monthly outlook maps are below.  For temperature, a warmer than normal July is expected for a large part of the country.  The odds are particularly good (70% or above) for parts of the Southwest.

July precipitation, as usual, is less certain, although, we see some enhanced odds of high than normal July precipitation in the Southern Plains, along the Gulf Coast, and parts of the East Coast.

July Temperature Outlook

July Precipitation Outlook

Jul-Aug-Sep Season

Somewhat similar to expectations for July, the Seasonal Outlook shows enhanced odds of a warmer than normal Jul-Aug-Sep.  The odds are highest in parts of the Northern Plains, Intermountain West, and the West Coast/Pacific Northwest.

Precipitation for Jul-Aug-Sep is more up in the air, however, the models are picking up on the possibility of reduced precipitation in western Montana and Idaho while the Gulf and East Coast could continue their recent trend of enhanced precipitation through September.

Jul-Aug-Sep Temperature Outlook

Jul-Aug-Sep Precipitation Outlook

Rainfall from Cristobal Largely Misses Areas in Drought

Rainfall from Cristobal Largely Misses Areas in Drought

The path of Cristobal produced a number of impacts across the Gulf and middle of the country including the Corn Belt.  As Cristobal departs for areas north of the Border, we see that the storm produced some very heavy bands of rain up into Wisconsin.

7-Day Observed Rainfall. The impact of Cristobal can largely been seen in the orange/red colors.

Gulf Coast Drought Recovery

While the storm surge from Cristobal was close to 6-feet, one benefit from the storm is areas along the Coast that have been extremely dry will have mostly recovered.  The map below shows last week’s drought monitor and we expect when the new map comes out tomorrow (Thursday, June 10, 2020) most of the Gulf Coast should be drought free.

For the rest of the areas in drought, we expect to see drought intensifying in the Texas Panhandle, Colorado, Wyoming,  and Montana. 

US Drought Monitor from June 4, 2020, along with areas in blue that received at least 3" of rainfall over the last 7-days.

Forage Production in 2020, A Mixed Bag

Forage Production in 2020, A Mixed Bag

The latest forage production outlook was released last week from USDA and its partners.  The forage outlook, called Grass-Cast, shows three different forage production scenarios for the Great Plains (or at least most of the Plains) that could occur between now and August 31st.  Those scenarios are based on whether we get above, near-average, or below average rainfall for the growing season.  Production is in  “pounds per acre of peak standing biomass”.

Grass-Cast is designed to be used with NOAA’s Temperature and Precipitation Seasonal Outlooks.  The latest outlook maps for June-July-August are below.  As you can see the odds are tilted for a warm summer for most of the country.  Precipitation on the other hand–and the more challenging forecast to make–is favoring dry conditions in parts of the West and Pacific Northwest, and wet conditions in the Midwest and East.

Forage Outlook

Parts of the Great Plains are seeing precipitation deficits going back to January and beyond.  These deficits have been incorporated in the Grass-Cast Outlook, which is why two of the forage scenarios are showing reduced forage production for many counties this growing season.  To give you an idea of what this looks like take a look at the interactive map for  Near-Normal Precipitation forecast scenario.   Areas in red or orange show reduced production even if rainfall is close to average for the rest of the summer.  The second interactive map shows precipitation deficits for each county from January through May and hopefully will give you an idea of just how far below or above average you are for the calendar year.

Interactive Maps Showing the Forage Production Forecast if Precipitation is Near-Normal this Summer

Precipitation: Odds of Catching Up

Looking at the current precipitation deficits, what are the odds we could see average or above average conditions for the rest of the summer using historical data going back to 1895?  Thankfully we have a way to do that at the level of an individual county  using the County Precipitation Analysis Tool that was developed by Dr. Becky Bolinger at Colorado State University.  The graph on the right shows how frequently precipitation in June-July-August has been below or above average since 1895 using Baca County, Colorado as an example.  Since 1895, summer precipitation in Baca County has been above average 41 times, or about 33% of the time, since 1895.  So, Baca County has a one-third chance of at least getting to average precipitation, which using the Grass-Cast scenario of Near-Normal means forage production could be reduced by about 20% from average conditions.  Not a great outlook for Baca County.  They have been in a precipitation hole for sometime and will take an extraordinary summer to get them out of it.

For those in the area covered by the Grass-Cast Outlook and would like to see how likely your county could see average or above-average precipitation this summer we have provided the County Precipitation Analysis Tool below.  To do the analysis similar to the example, choose your state and county.  For the month choose August and for the number of months choose 3-months.  That will show a frequency distribution of precipitation from June-July-August for your county from 1895 to present.

County Precipitation Analysis Tool

 Loading...
This state has no counties.

2020 Summer Outlook

2020 Summer Outlook

The 2020 Summer Temperature Outlook (Jun-Jul-Aug) is indicating fairly high probabilities of above-normal temperatures for a large part of the U.S.  Parts of the West, states along the Gulf Coast, and the East Coast have a 60-70% chance of seeing hotter than normal temperatures this summer. The largest probabilities (above 70 percent) are centered over the Four Corners region due to forecast models picking up on a reduced precipitation trend in the area and declining soil moisture conditions. Equal Chances of below-, near-, or above-normal temperatures are forecast from the upper to middle Mississippi Valley along with parts of the northern to central Great Plains.

Summer Precipitation

The Summer Precipitation Outlook shows a tilt in the odds of above normal precipitation for much of the eastern and central U.S., while below-normal precipitation is more likely across the Pacific Northwest, northern Great Basin, and much of the Rockies. While the odds of reduced precipitation are not solid, the model results are nevertheless troubling given the ongoing drought in parts of Colorado, New Mexico, Utah, Nevada, and the West Coast.

Drought Outlook for Jun-Jul-Aug

With the beginning of the May-June dry season in the West (see the article from Becky Bolinger on the prospects of coming out of a drought during the dry season) it is not looking good for drought improvement in the region.  The precipitation and temperature forecasts and outlooks shown above are indicating the current drought will persist over the next three months and could expand in the Pacific Northwest, the Northern Intermountain Region, parts of central California and the Central Great Basin, which is shown in the latest Seasonal Drought Outlook below.

On the brighter side, drought removal or improvement is expected for parts of the Central and Southern High Plains.  The wet season in full swing in some of these areas and it could be a huge help to improve soil moisture conditions in areas that have been very dry for the last several months.  For the areas of drought near the Gulf Coast, nearly all official precipitation outlooks favor drought removal for most areas.

May 4th Crop Progress Report: First Pasture and Range Condition Estimates of Growing Season

May 4th Crop Progress Report: First Pasture and Range Condition Estimates of Growing Season

USDA released its latest Crop Progress report on May 4th.  Included in the report is the first reports of pasture and range conditions for the 48 contiguous states (map below).

The map combines the percentage of pasture and range in Poor and Very Poor conditions.  Some fairly obvious pockets are showing up in the West, Southern Plains, and the New England. 

Based on precipitation data from April (map below) we are seeing some fairly significant drying trends in the Central Plains, the Southwest and Northern California/Pacific Northwest.

We’re just getting started but drought has a way of sneaking up on people so stay alert out there!

May 1st Beef Cows in Drought

May 1st Beef Cows in Drought

Given what’s going on with the cattle market and smaller numbers of cattle being placed into feedlots we wanted to also take a slightly different look at beef cows and drought this week.  We usually show the US Drought Monitor, which is a compilation of multiple drought indicators, but given the potential for cattle spending a longer period of time on pasture this year we wanted to focus more on precipitation deficits, and so have used data from the Standardized Precipitation Index (SPI). 

SPI data are used in the Drought Monitor but so are other indicators which might not correlate as well with grass production.  Based on 2019 survey data from NASS, we estimate there are approximately 18% of beef cows are in at least Moderate Drought.  We do expect areas along the Texas Gulf Coast and into Louisiana to improve, however, parts of the Intermountain West and the West/Pacific Northwest could be headed for a long summer with somewhat limited grass production.