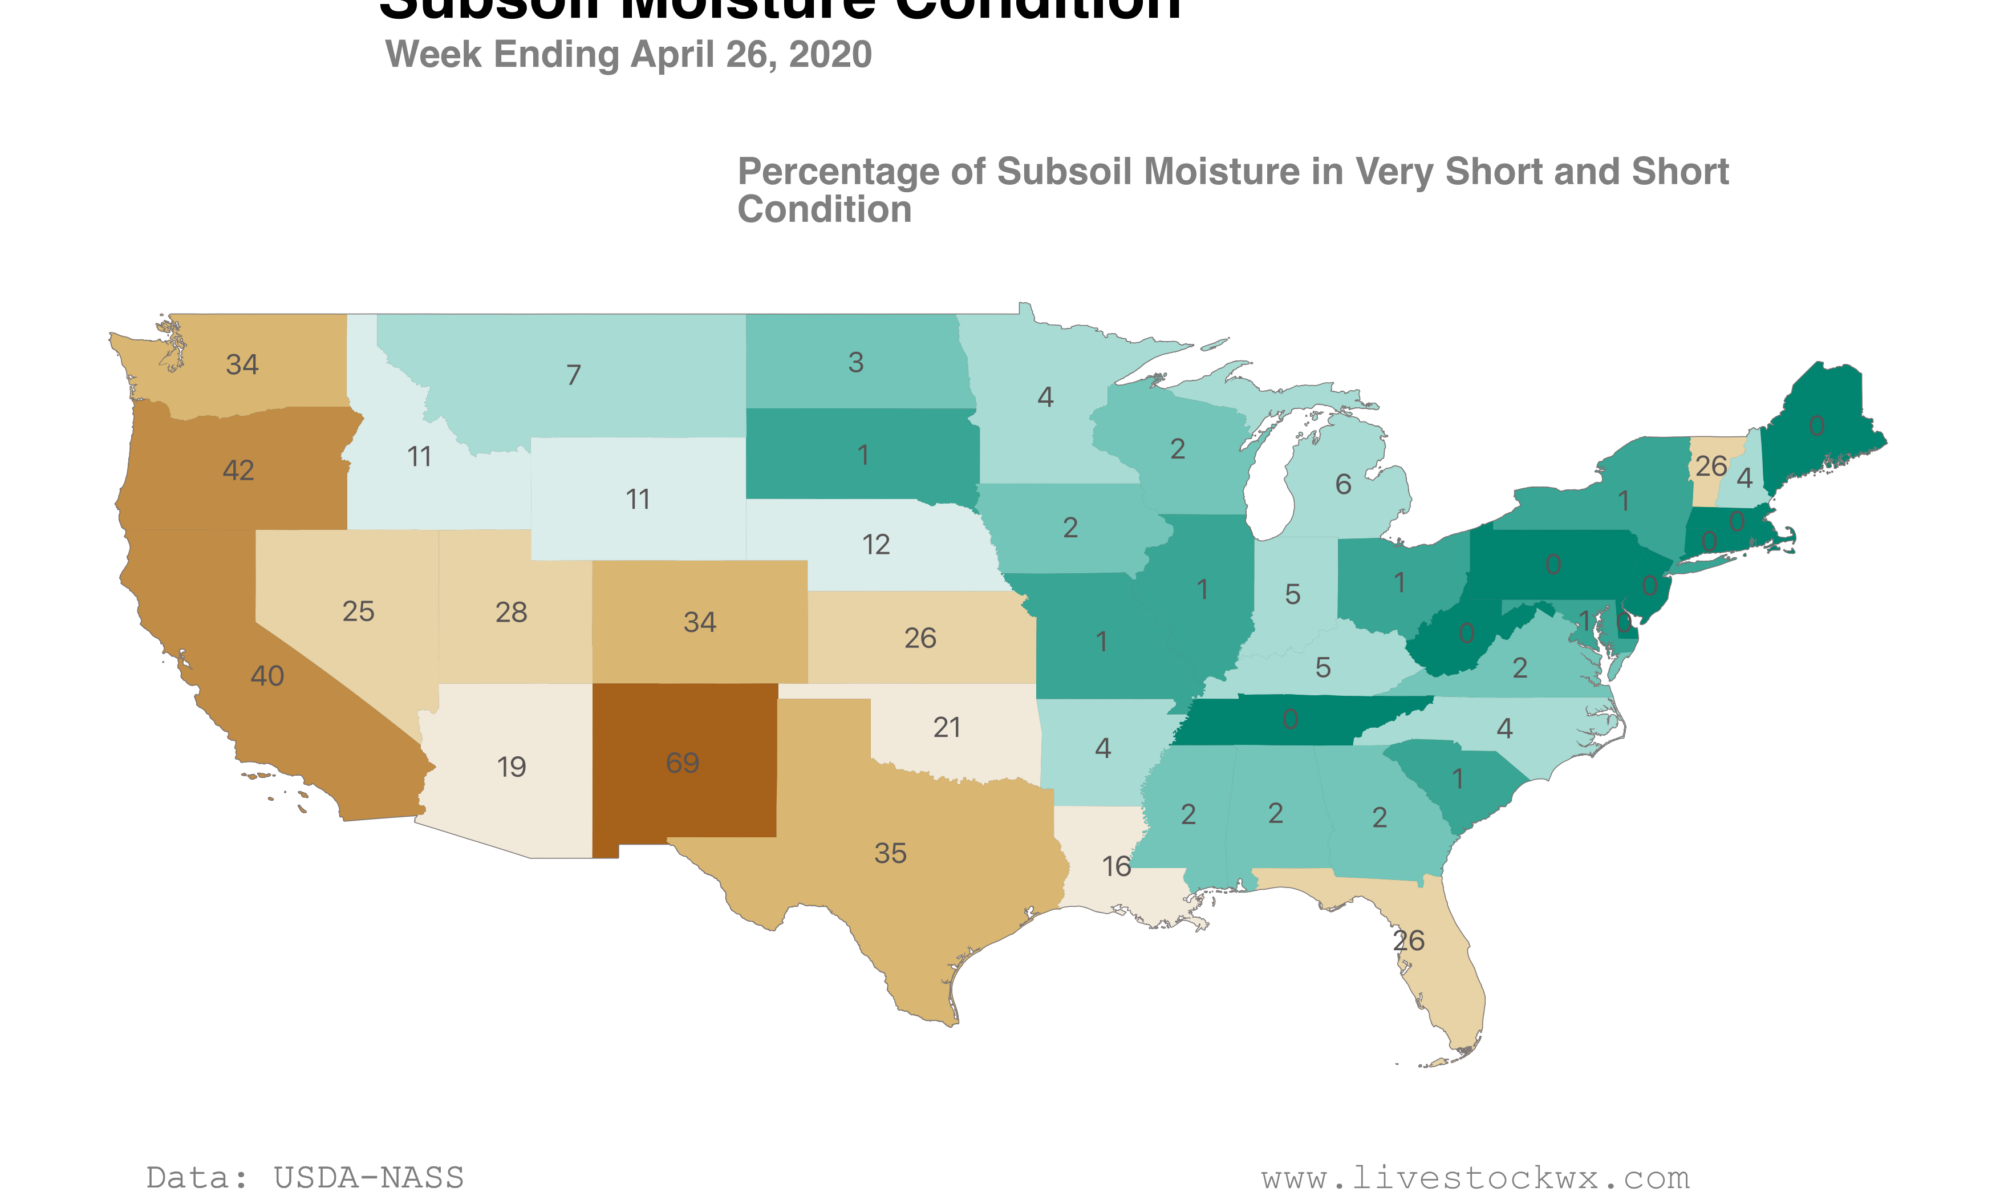
Subsoil Moisture Update: Dry in the West, Wet in the East

Subsoil Moisture Update: Dry in the West, Wet in the East

USDA is expected to release its first pasture and range report next week for the 2020 growing season.  In anticipation of the report we thought we would take a look at the current state of soil moisture and where we stand with drought around the country.

The map below shows the percent area of subsoils considered in the Very Short and Short categories for each state by USDA.  Note the striking divergence between the West and the Midwest and East.

If you want a better break down for each state, the map below shows a new tool by NASA that estimates root zone soil moisture—among other things—each week for the Contiguous U.S.  The data are from the GRACE satellite mission and are percentiles based on averages between the years 1948-2012.  The most current map paints a fairly somber picture for parts of New Mexico, Colorado, and the West/Pacific Northwest.

Florida Observed the Hottest and Second Driest March on Record. Big Change Compared to March 2019

Florida Observed the Hottest and Second Driest March on Record. Big Change Compared to March 2019

NOAA released their climate rankings this morning (April 8th) for this past March.  What a difference a year makes. Last year we were discussing what a cold, and in some places, extremely wet (i.e. Central Plains) March it had been.  Florida just experienced its warmest and second driest March on record going back to 1895.  Texas observed its third warmest March, but it was also in the top 10 wettest March on record (see the below maps for your state). What gives?

If you break things down a bit and look at variation within the states, you see there was a big break between the northern and Southern regions of the Gulf States.  For example, North Texas observed its second wettest March on record while South Texas observed near normal precipitation.

So now we know how this past March compared to the long-term record, how different was it compared to March 2019?  The images below are pretty striking.  The first two show how much 2019 and 2020 deviated from what we would typically expect (based on averages from the 30 years between 1981-2010).  In 2019 there were not a lot of oranges or reds. Just a lot of blue compared to this year where many states were in their top 10th percentile! 

The last image shows the percent difference of 2019 to 2020.  While the percent difference was positive for most of the country, we really see big positive values in the Northern Plains. Some places in North and South Dakota saw a 60% or more increase in their average March temperature. That’s pretty striking. The Southern Plains have also seen an increase but mostly in the 10%-30% range. The bottom line here is that while Florida broke a record for their warmest March, the Northern and Central Plains observed a pretty drastic increase from 2019 to 2020.  This should translate into a much better calving and lambing season for producers in those areas.

Seasonal Drought Outlook Update for Apr-May-Jun 3.2M Beef Cows Could be in Drought by end of June

Seasonal Drought Outlook Update for Apr-May-Jun 3.2M Beef Cows Could be in Drought by end of June

The U.S. Seasonal Drought Outlook was released on March 19, 2020, and is valid from March 19 to June 30, 2020.  It is a subjective assessment of the U.S. Drought Monitor and the NOAA Three Month Outlooks.  The Outlook helps predict whether drought will emerge, stay the same or get better in the next three months.

The Seasonal Drought Outlook for the next three months shows a relatively large area along the West Coast and Southwest will be experiencing drought.  Florida has also popped as an area to watch after experiencing one of their warmest and driest March’s on record.

Daily Image: Seasonal Drought Outlook Update for Mar-Apr-May. 1.8M Beef Cows Could be in Drought by June

Daily Image: Seasonal Drought Outlook Update for Mar-Apr-May. 1.8M Beef Cows Could be in Drought by June

The U.S. Seasonal Drought Outlook was released on February 20, 2020, and is valid from February 20 to May 31, 2020.  It is a subjective assessment of the U.S. Drought Monitor and the NOAA Three Month Outlooks.  The Outlook helps predict whether drought will emerge, stay the same or get better in the next three months.

The Seasonal Drought Outlook for the next three months shows a relatively large area along the West Coast and Southwest will be experiencing drought.

Anyone can Look at Average Precipitation. Don’t Be Average! Check Out Livestock Wx’s Latest Product for Estimating Precipitation Frequency

Anyone can Look at Average Precipitation. Don’t Be Average! Check Out Livestock Wx’s Latest Product for Estimating Precipitation Frequency

Livestock Wx is proud to release a new product called the County Precipitation Tool.

The Tool gives livestock producers the ability to see how often precipitation has been below, average, or above average for any given county in the contiguous U.S. for a month or a range of months. In short, the tool allows a person the ability to see the odds of getting more or less precipitation than average for their county.  In most cases, average precipitation does not quite capture how an area experiences precipitation.

The reason for this is that unlike temperature, precipitation does not have a “bell curve” distribution where the average temperature reflects pretty well the most commonly occurring temperature for a season, month, or day.  For most days of the year precipitation is zero but if you were to average the amount of daily precipitation for say Fort Worth, TX, you would get an average daily precipitation of 0.1” (36.7” divided by 365 days).  Anyone from Fort Worth feel like a tenth of inch of precipitation per day is a fair representation of how you experience rainfall (or a Texan’s worst nightmare ice)?

We are used to thinking in averages but for precipitation it is probably more helpful to think about it in terms of frequency of the most commonly occurring amounts for a season, month, or whatever timeframe you might be interested in looking at.  That is what the Tool we are introducing today will allow you to do.  The tool uses data from NOAA going back to 1895. We have also created a guide on how to use the product, which can be downloaded below.

The Tool was developed by Dr. Becky Bolinger from Colorado State University and came out of a discussion with the East Co Group, who is a provider of the Pasture, Rangeland, and Forage Insurance.  Dr. Bolinger wrote an article on the topic in November of last year.  We will be reposting that article in the coming days for those that would like to see a slightly deeper dive on the topic.

Please take a test-drive of the Precipitation Tool and let us know if you have any questions or ways it could be improved.

County Precipitation Tool

 Loading...
This state has no counties.

Water Year Update: Winners and Losers…So Far

Water Year Update: Winners and Losers…So Far

Here at Livestock Wx we thought it would be good to do a check-in on how the 2020 Water Year is looking so far and who the early winners and losers in terms of precipitation.  Please note, however, that just like not enough precipitation is problematic, too much of it can be just as bad if not worse.

So far, there are some clear “winners” so far and that includes most of the eastern half of the country while parts of Texas and the West could be considered in the “loser” or not enough moisture category.  Some places like the Pacific Northwest have had a very strong last couple of months so we expect parts of that area to come back somewhat.

NMME Outlooks for Mar-Apr-May

NMME Outlooks for Mar-Apr-May

The North American Multi-Model Ensemble forecast, or NMME, was released this week.  The NMME is a collaboration of the National Weather Service and several university partners to produce a consensus seasonal forecast using a suite of different climate models.

The models are indicating pretty good odds for above average temperatures (see temperature map below: orange-dark orange equals higher odds of above normal temperatures) in the March-April-May timeframe and a minor tilt in the odds for less-than average precipitation in New Mexico, Far West Texas, and the Panhandle (see precipitation map below: green colors equals higher odds of above normal precipitation).  The eastern half of the county as well as parts of the Northern Plains/Midwest have an increased chance of above normal precipitation potentially adding to what has been a fairly wet year.

NOAA will release its official outlooks for March-April-May next Thursday (Feb. 20th).  Since they utilize the NMME models in their official forecast consider this a sneak preview.

Temperature Forecast

Precipitation Forecast