Livestock Wx
Reducing the Current Drought: Historically What are the Odds Drought Will Improve this May-June?
- Becky Bolinger
- May 26, 2020
- 2:00 pm
One of the most basic definitions of drought is a deficit of precipitation over an area. Because each location of the world has its own unique climate, we have to consider what’s “normal” for a location to assess if there’s a deficit over a time period.
Using county precipitation data, subtracted from the average for the 1981-2010 time period, the map below shows counties with a precipitation deficit greater than half an inch from January through April 2020.
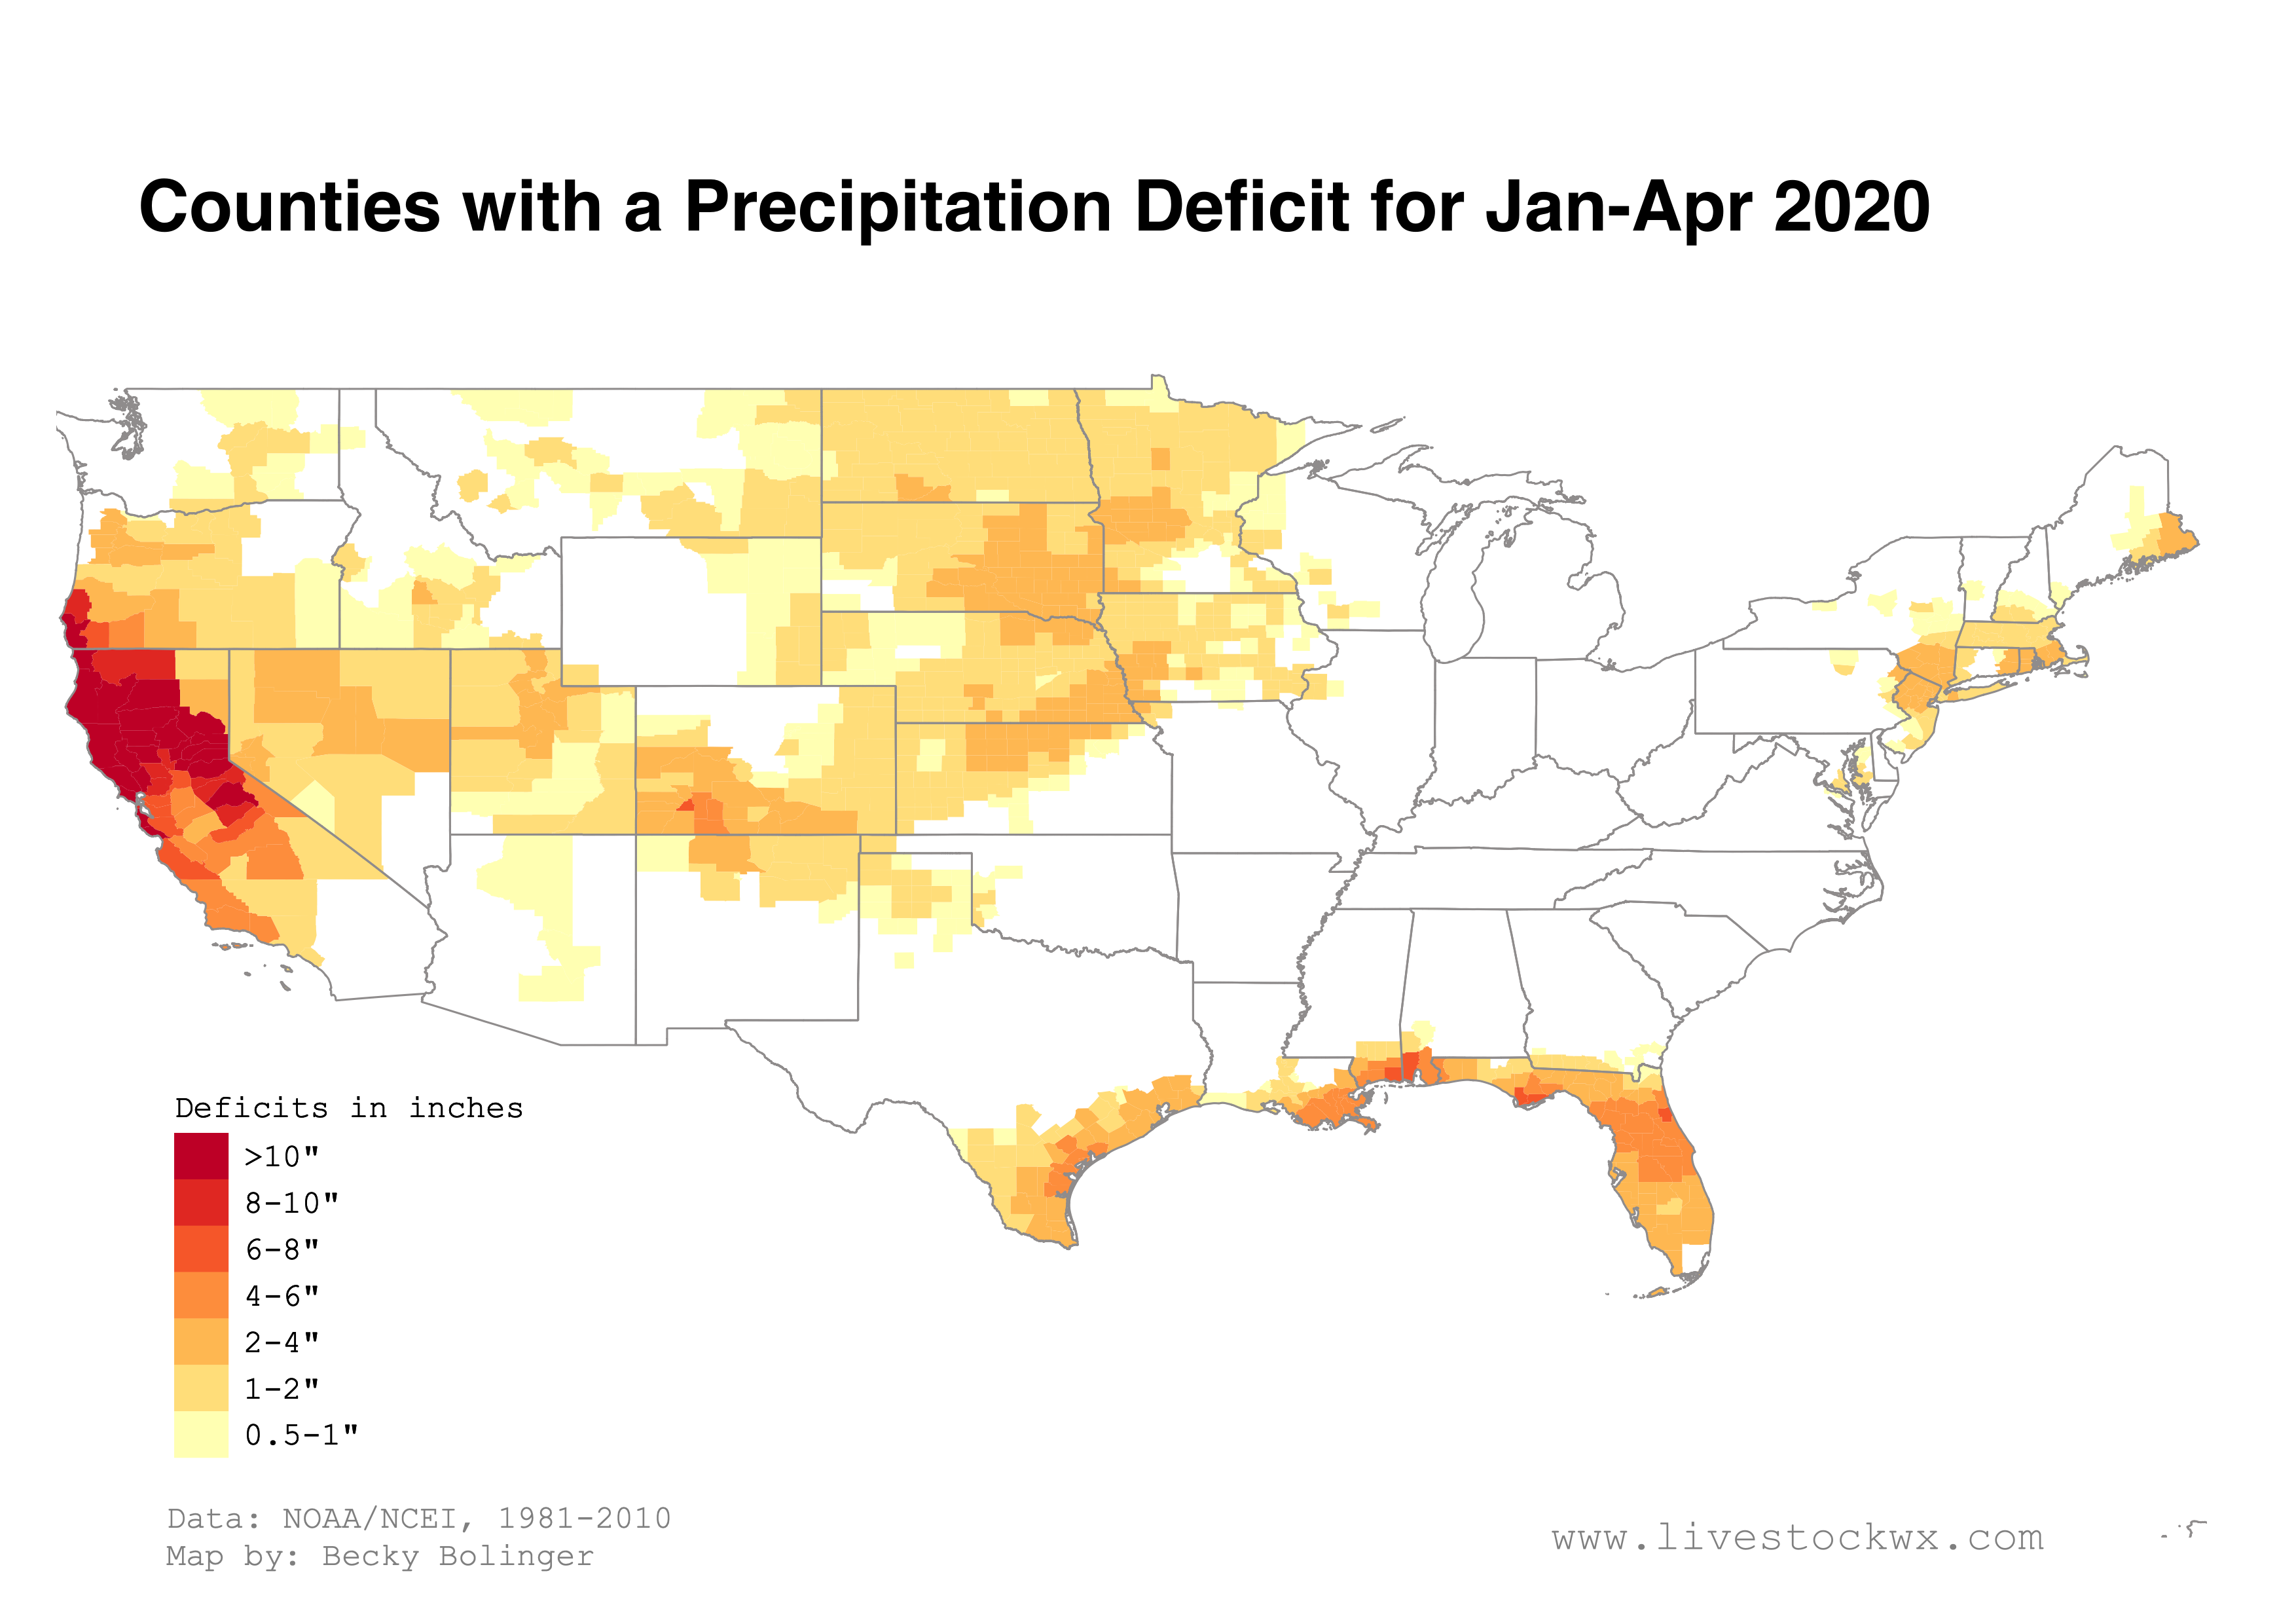
Some widespread areas with deficits to note are along the West Coast, the northern High Plains, and along the Gulf of Mexico. Northern California shows the biggest deficits – many counties have accumulated over a 10-inch deficit during their wet season. Counties along the Gulf coast are showing deficits between 1 and 8 inches.
Much of the High Plains, extending from Colorado and Kansas north through Minnesota and North Dakota, have seen deficits ranging from half an inch to 4 inches. This may not seem like a lot, but the impacts of these deficits have included drying soils and slowed growth as grasslands come out of dormancy.
Chance of Drought Improvement
For the central United States, May and June rank as two of the top three wettest months of the year. West of the Continental Divide, though, they’re actually transitioning to their dry season. Based on the current precipitation deficit map above, we wondered how likely those areas that are either in their dry or wet season could make up those deficits from earlier in the year? In other words, if you are entering into your wet season does that mean drought will almost always improve, while if you moving into your dry season, does that mean drought will most likely get worse?
Let’s take a look…
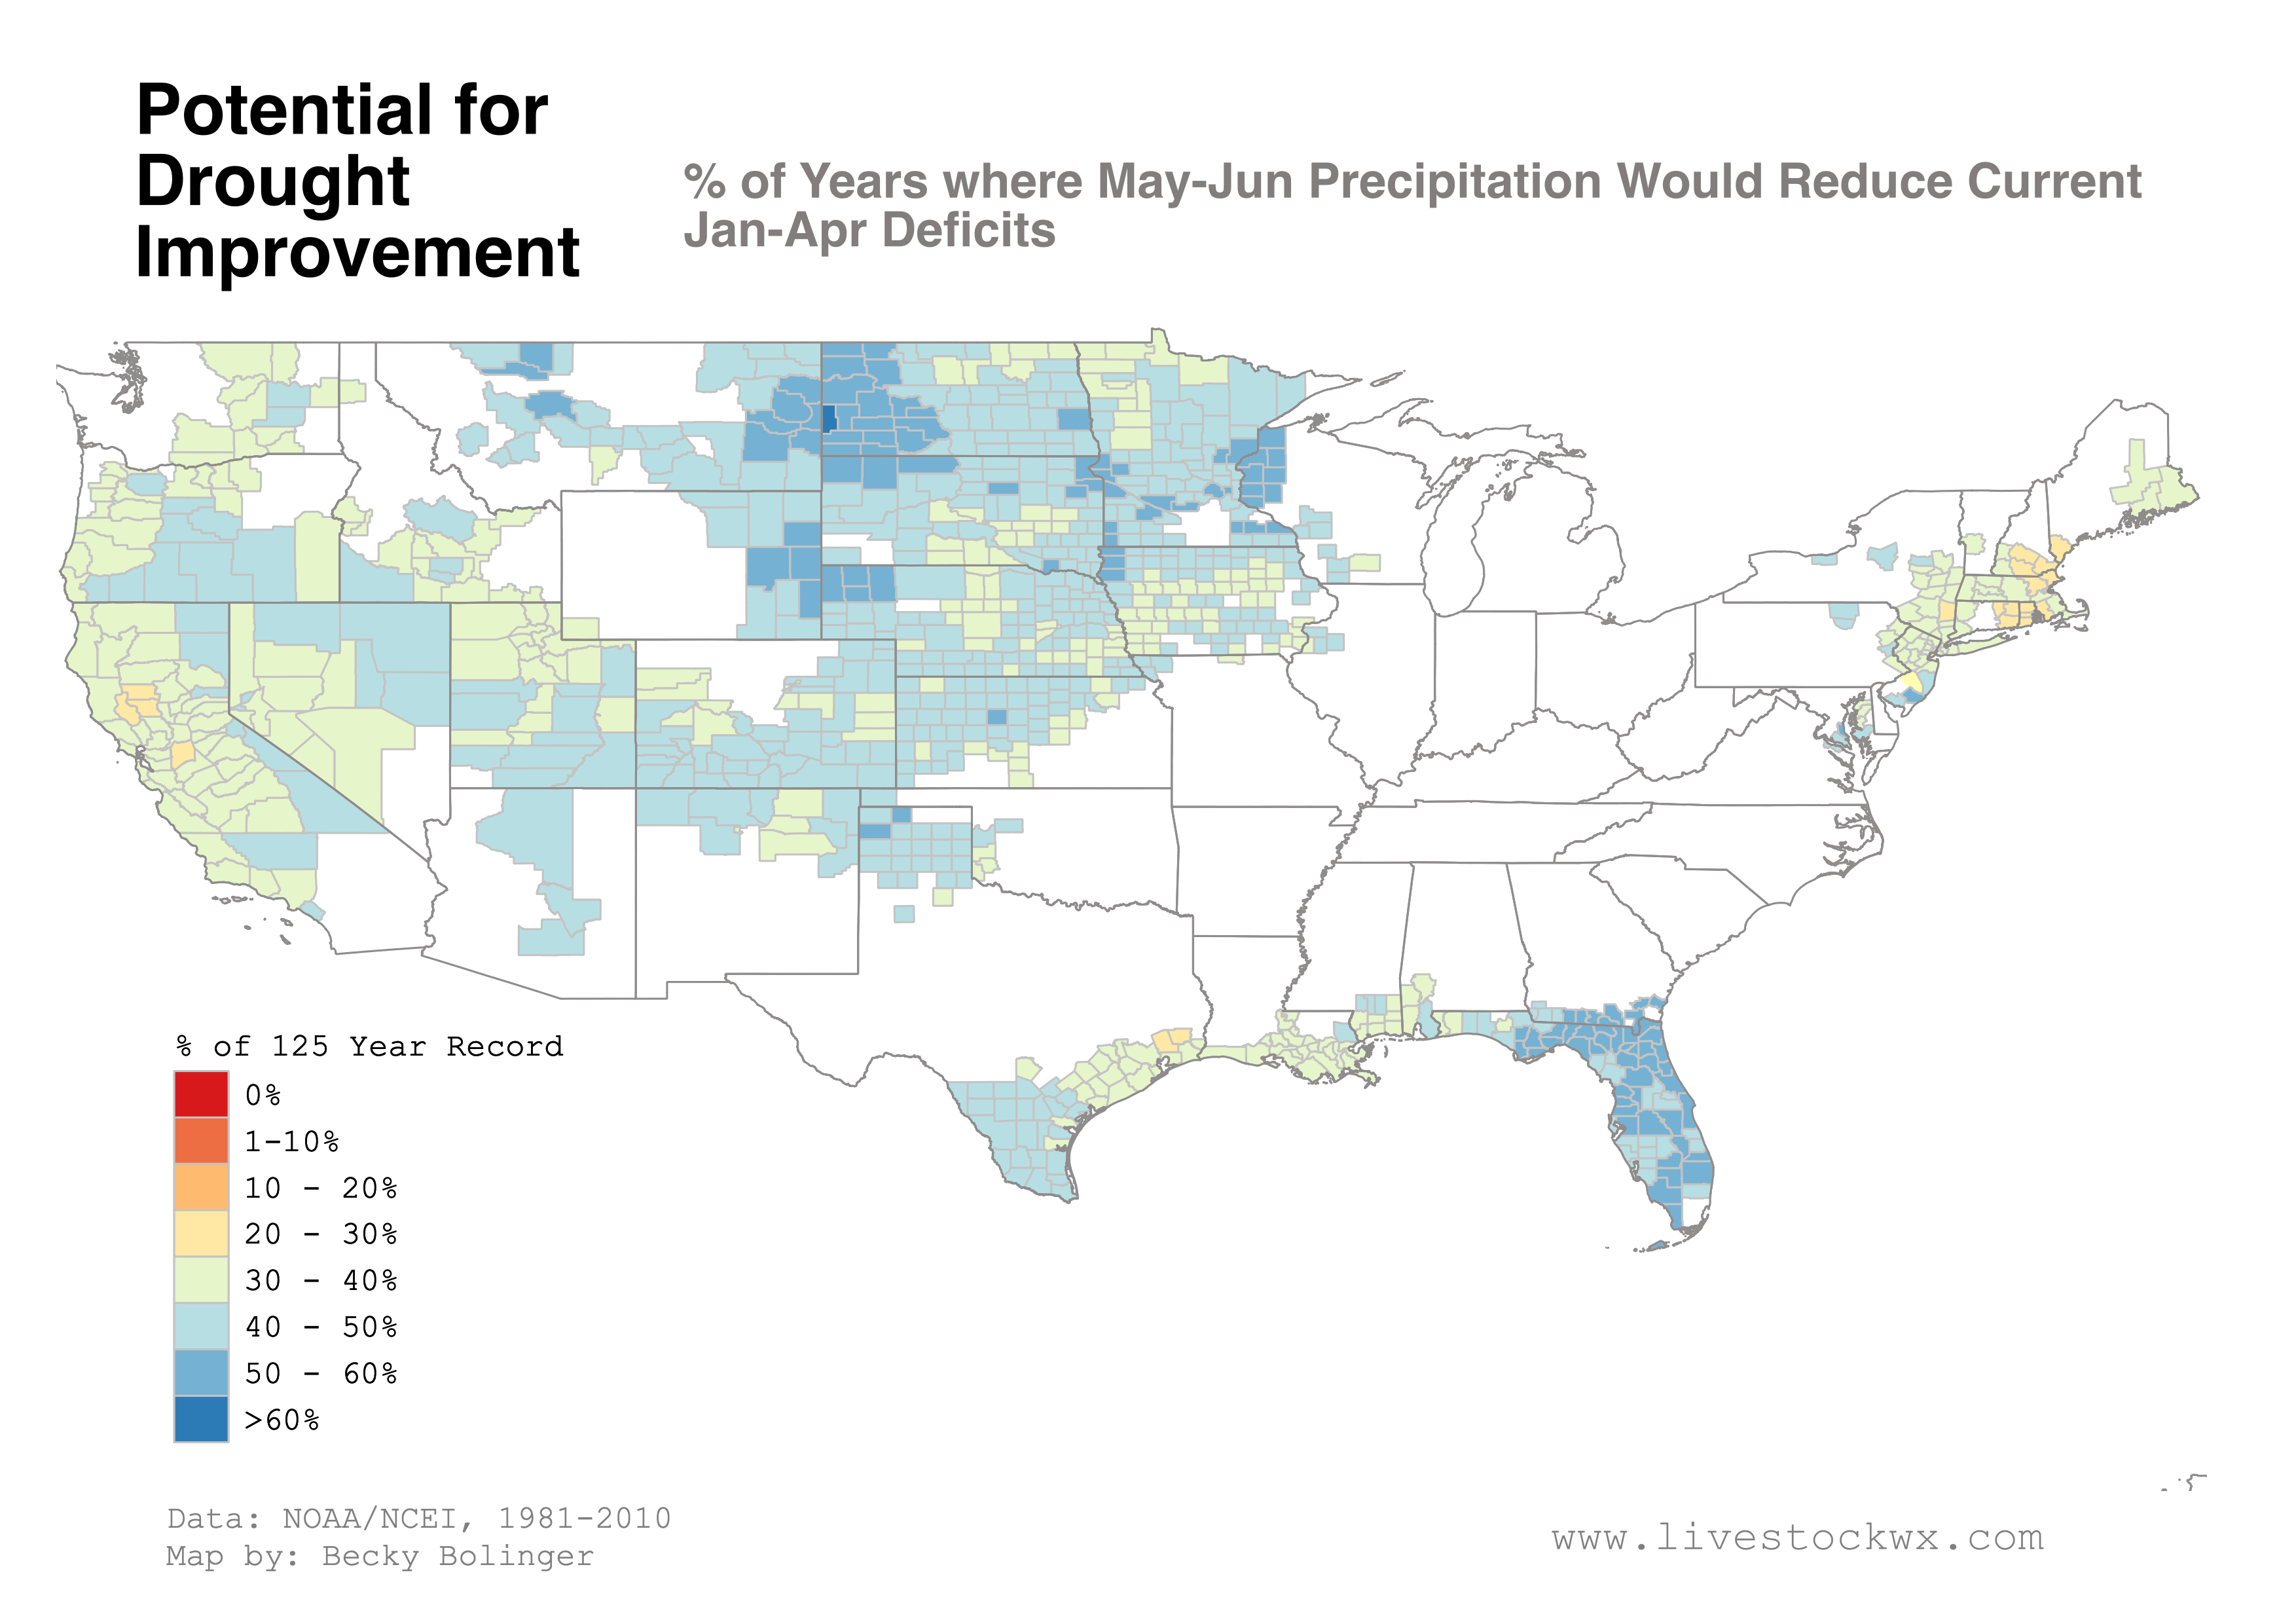
The above map shows for every county that currently has a January-April precipitation deficit, the percent of years where the May-June precipitation could help reduce or improve that deficit. For example, 30-40% of the time (using the entire historical record: 1895-2019), counties shaded in light green have received greater than average precipitation in May-June months. So, not only did they get what is normal for May-June, they got more to offset the deficit in 30-40% of the years. Counties shaded in light or dark blue, more than 50% of the time, they were able to get enough to reduce a deficit. You can see there is a higher percentage of years that reduce deficit coinciding with the wet season locations. And dry season locations have a lower percentage of years that reduce deficits in May-June.
Chance of Drought Elimination
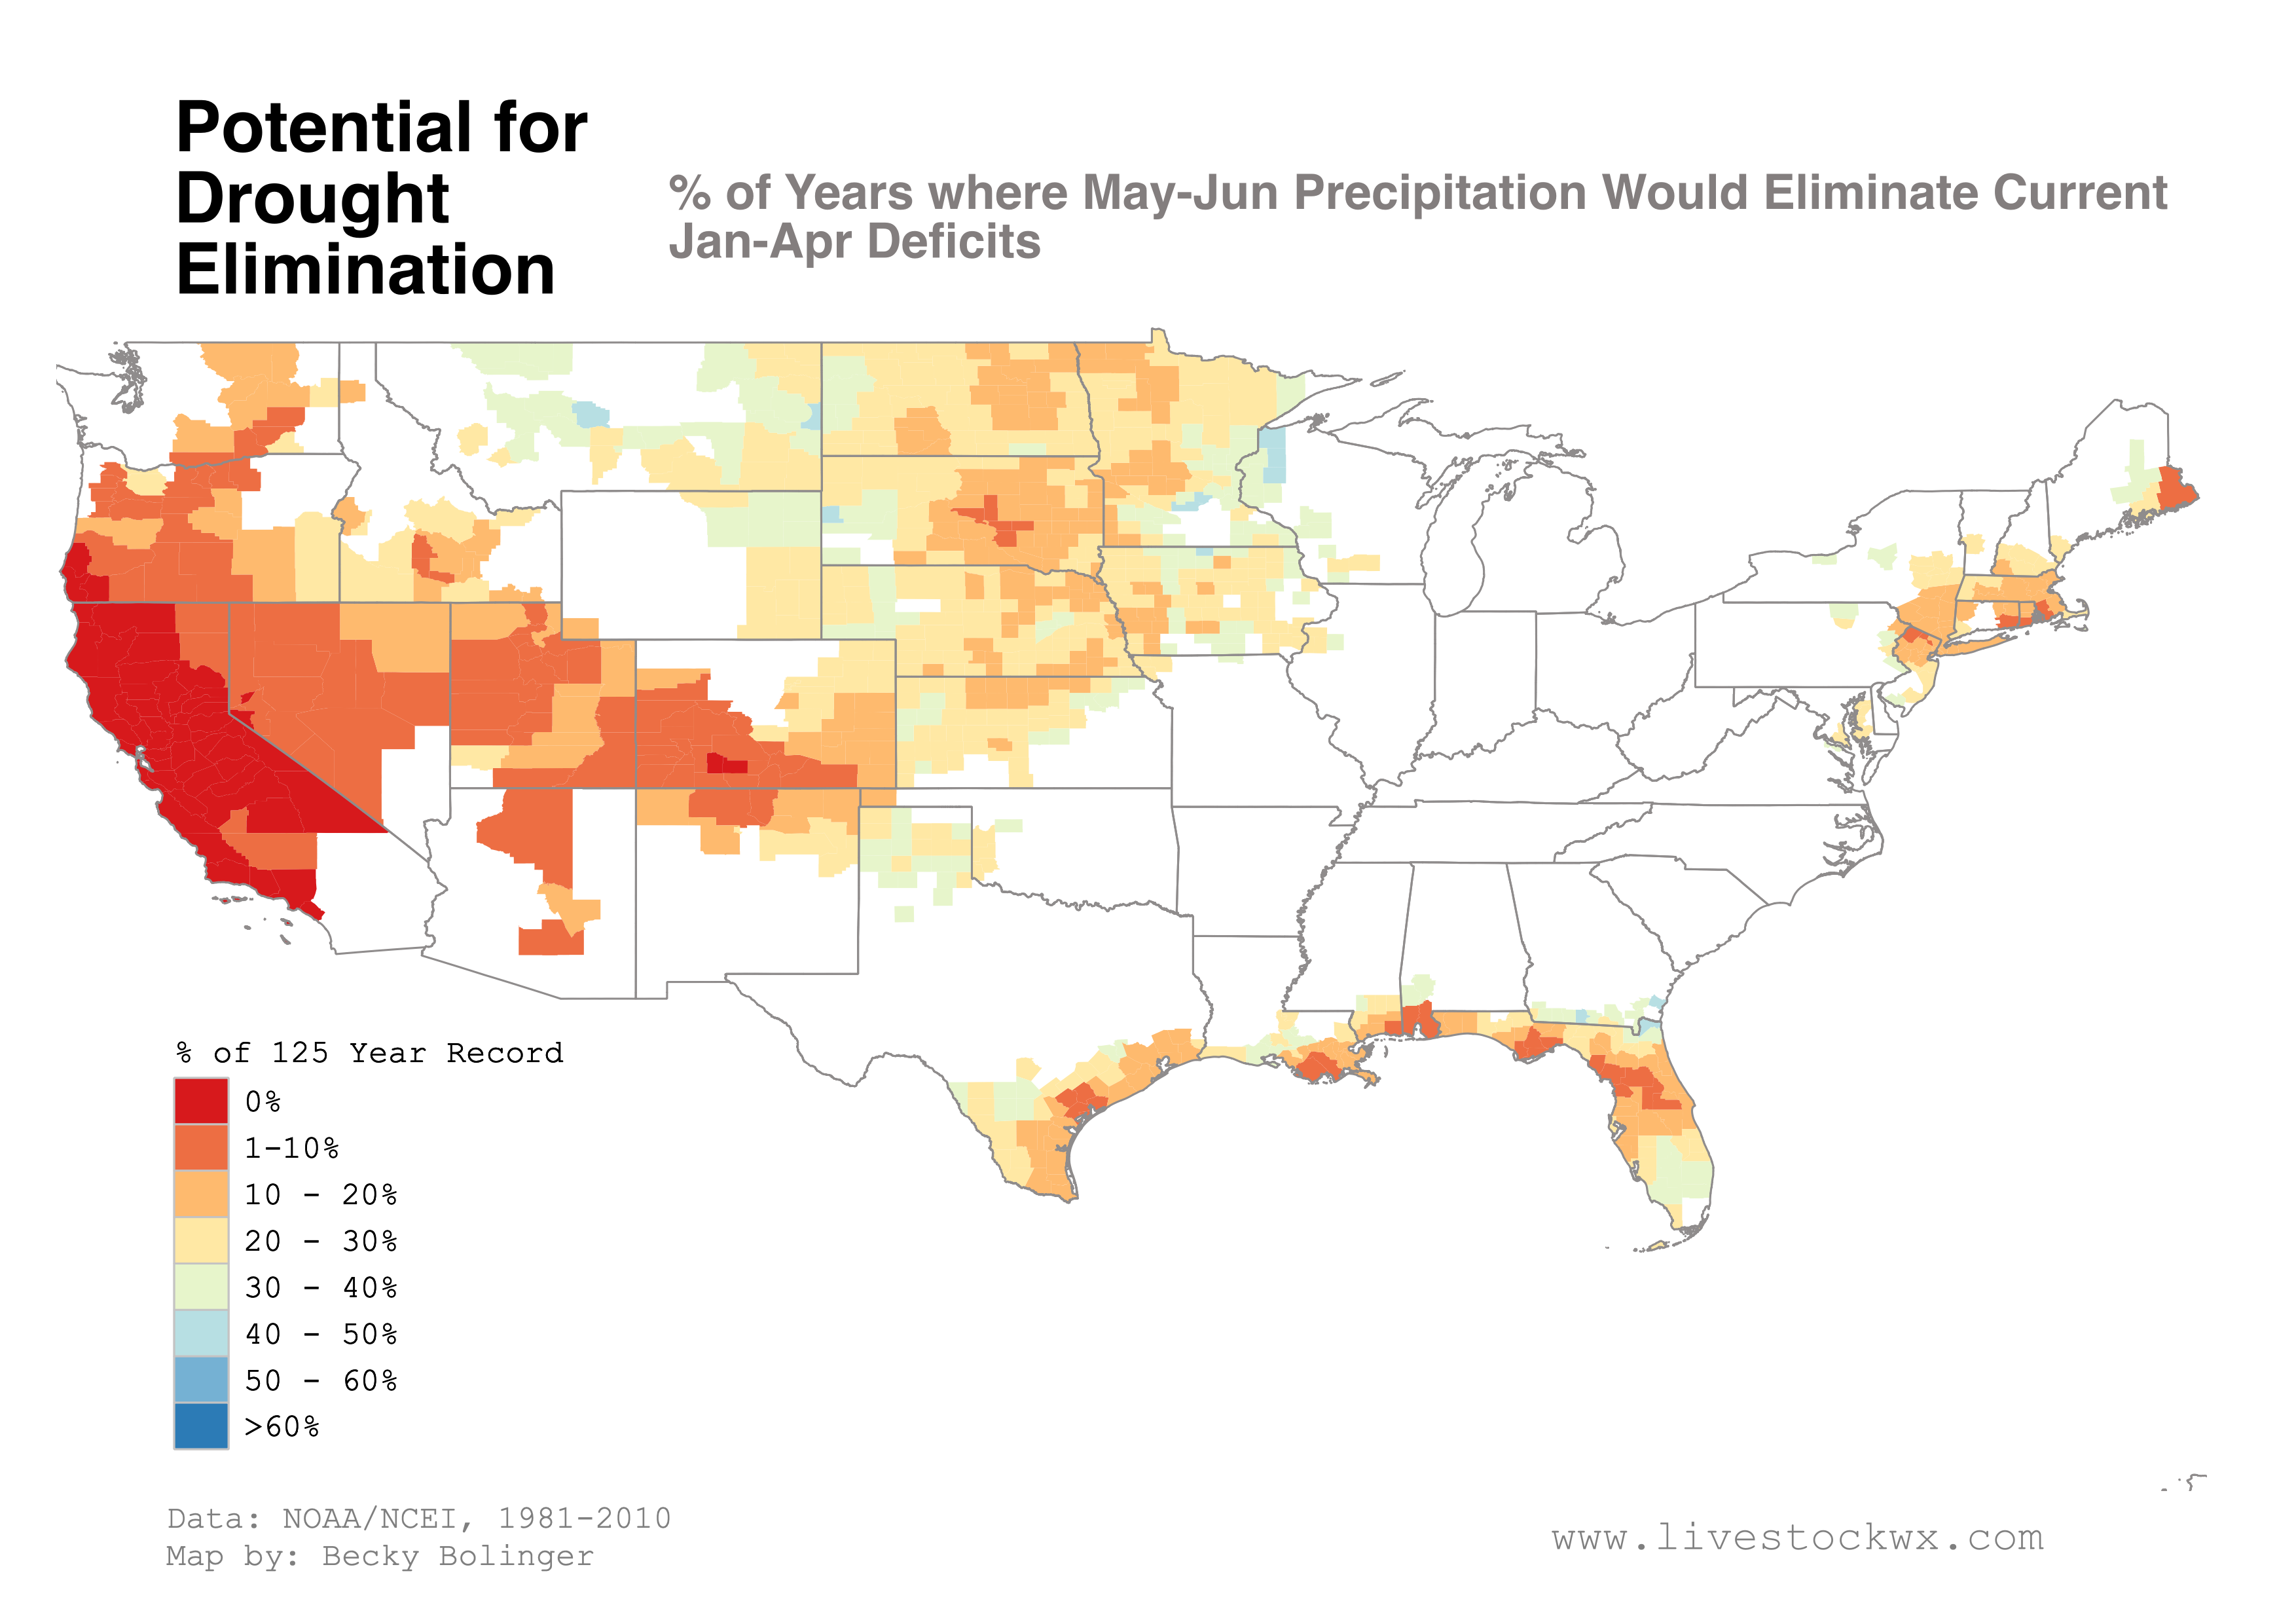
In the next map, we’re comparing the extent of the current deficit (Jan-Apr 2020) to the percent of years in the record that got their normal May-June precipitation, in addition to the at least the amount of the current deficit. In other words, if your county had a 2-inch deficit, and your May-June normal is 4-inches, you’d have to get 6-inches to eliminate the deficit. How often does that happen in May-June?
Many counties in the central portion of the country have had 20-40% of years where the May-June total could eliminate the current deficit. There are even a few counties with a 40-50% shot. Unfortunately, for many counties in Colorado and to the west, the percent of years that can eliminate the deficit is low. For southeast CO, this is partly due to how large the deficits are. The deficits are big enough that it is harder to eliminate. As you move west, the issue becomes the amount you can possibly get in May-June when those months are not typically a wet time of year. For counties shaded in gray (a few in southwest CO and most of California), there are no years in the record where May-June precipitation could eliminate the deficit. Basically, there is no chance (based on our 125-year record) of deficit elimination at this time.
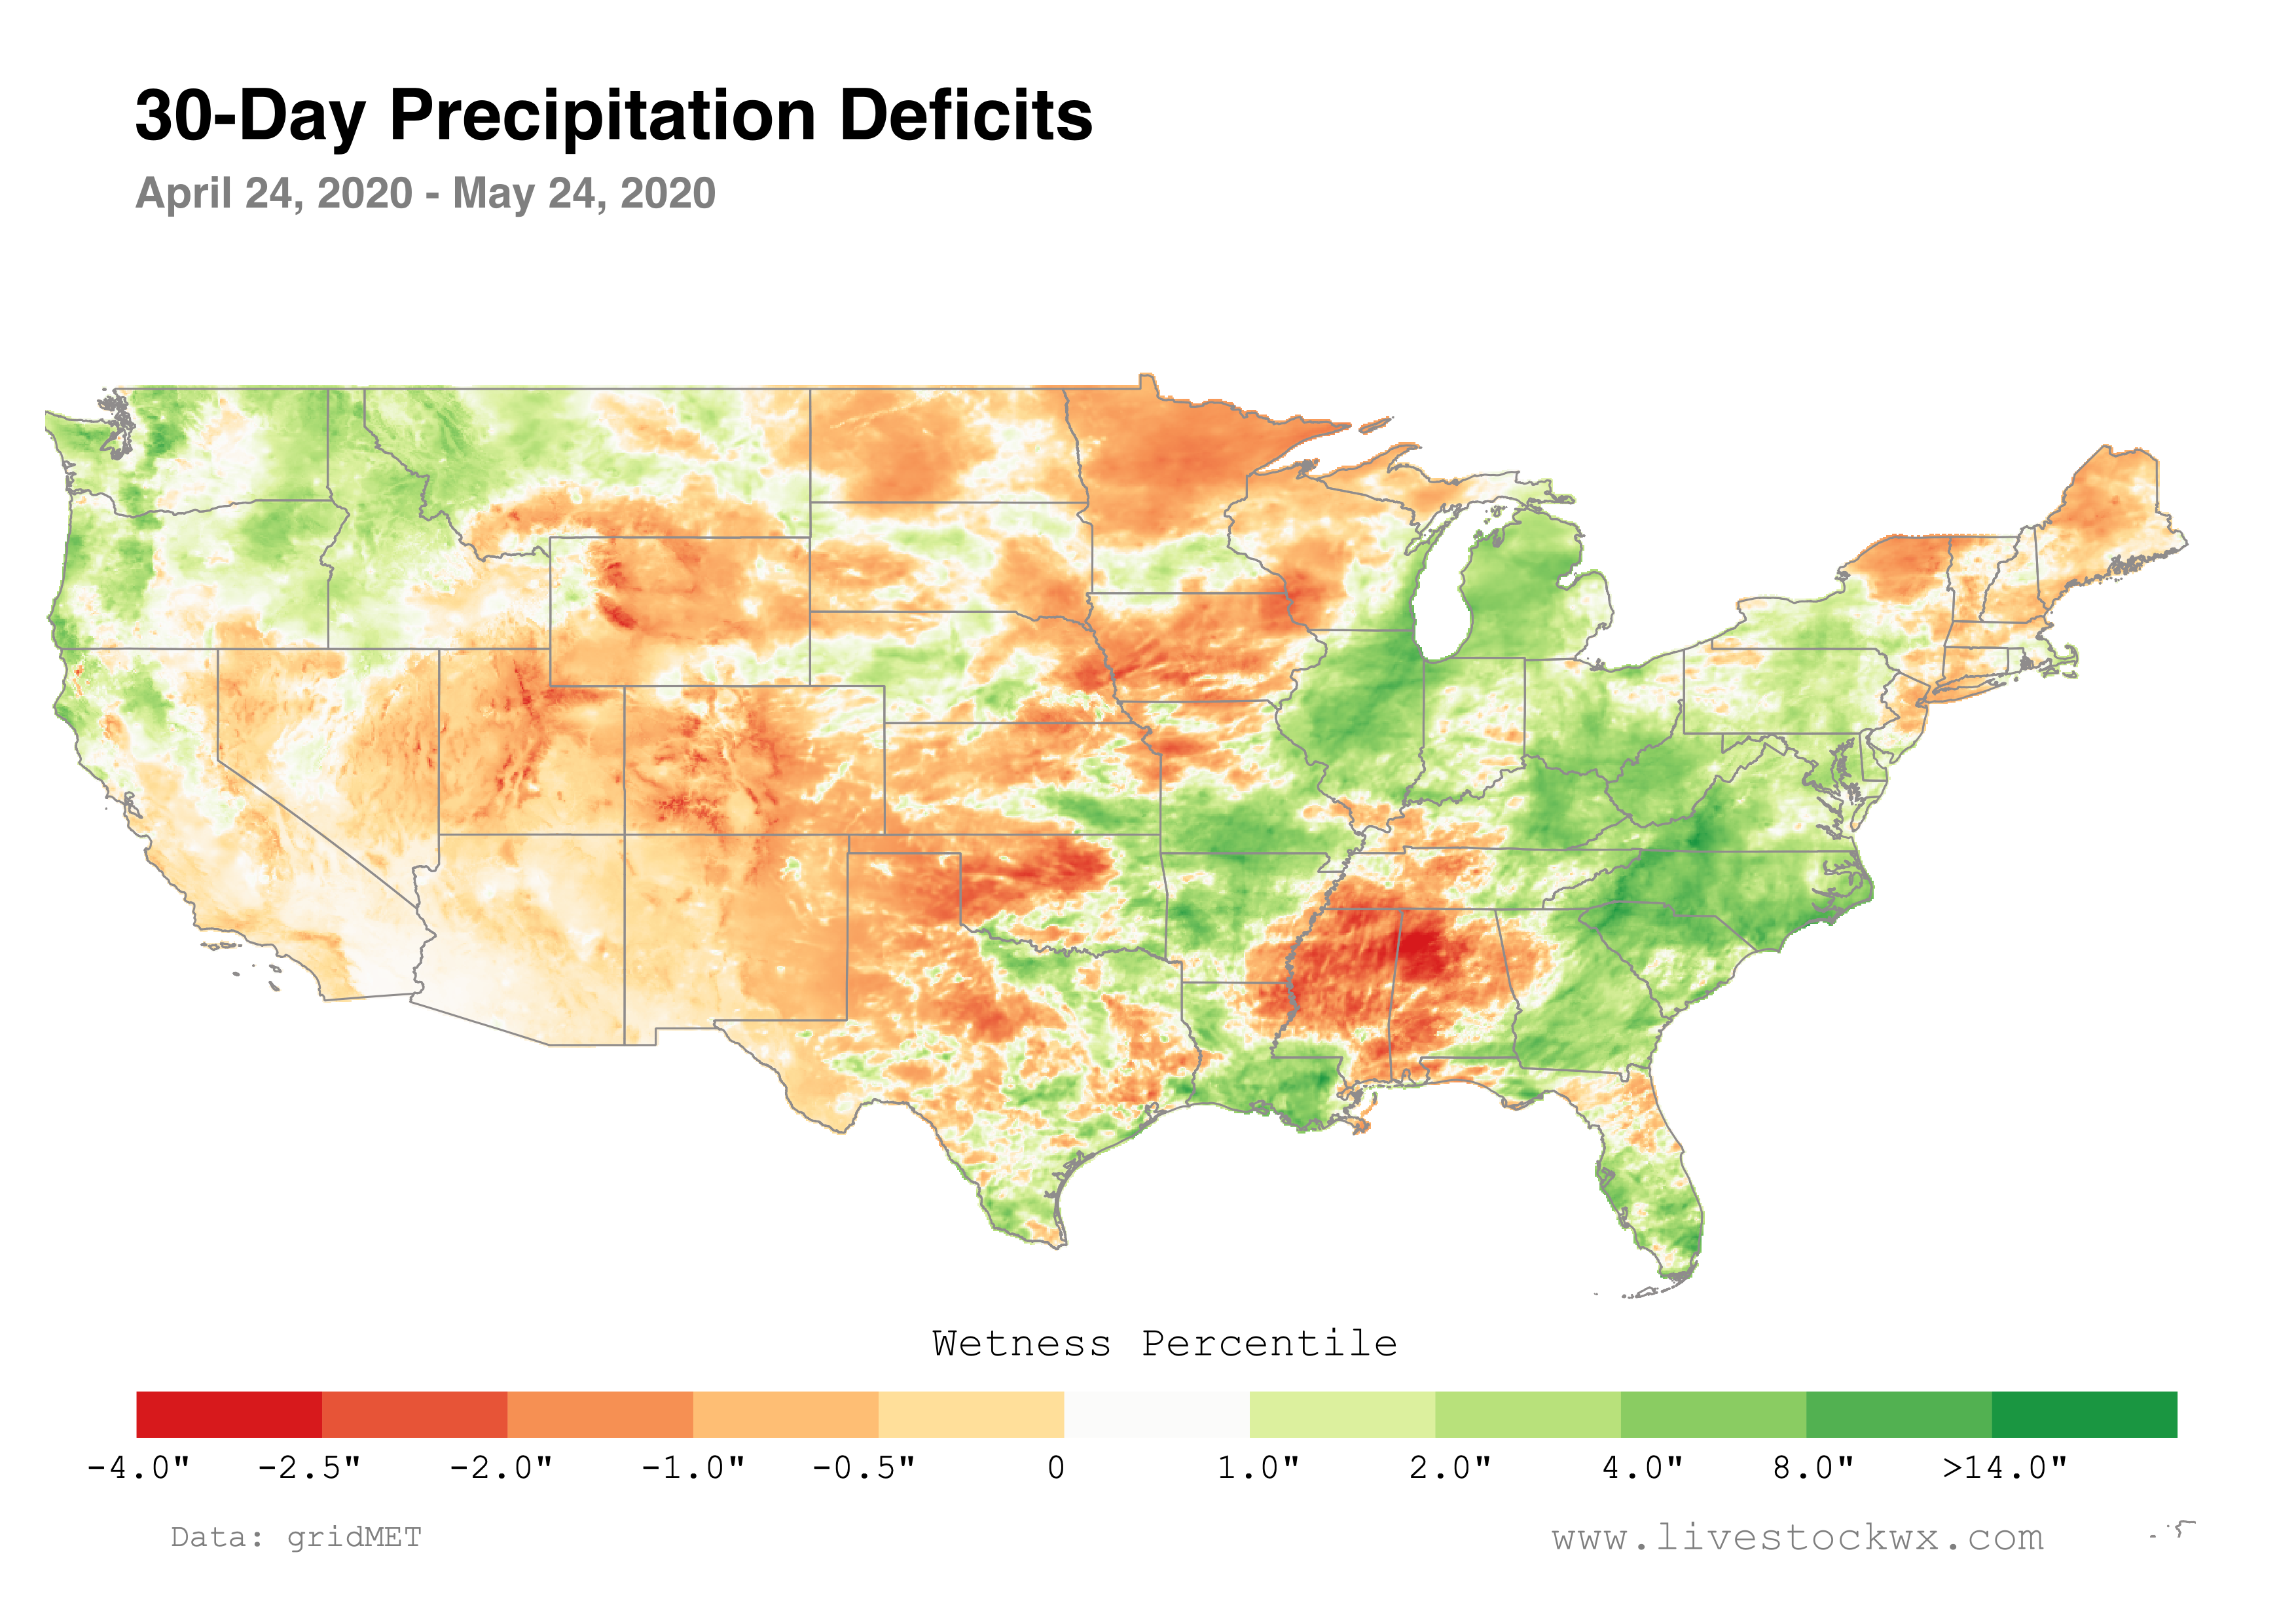
So, we’re most of the way through May. How are these areas doing? 30-day precipitation maps show green areas that have received greater than average precipitation for the majority of May and orange/red areas have received less than average precipitation. Parts of Nebraska and areas into South Dakota and Minnesota have gotten a 1 inch or more surplus of moisture in May. That’s good news for reducing deficits. In Northern California, even though deficit elimination is almost impossible, they have gotten a surplus to help chip away at their deficits.
For areas of Utah and Colorado that have built up deficits, they’ve unfortunately seen an increase in deficits for May. Instead of deficit reduction, their deficits have increased by 1 to 2 inches. That’s going to make it harder to reduce or eliminate.
In the last few days we’ve seen some decent moisture over the central U.S. and should help those Jan-Apr deficits. Unfortunately areas in western CO, Utah, and west into California will mostly missed out on the precipitation. There is hope though on the 8-14 day outlook, which shows an increased chance of above average precipitation in these areas. As for the month of June, there’s a lot of uncertainty about what could possibly happen. For areas in a deficit, it’s likely that you will experience some hot and dry days. And, as is typical with summer, expect thunderstorms to boost moisture in some locations and skip out on other locations.
Becky Bolinger
Dr. Bolinger is the Colorado Assistant State Climatologist. She is based at Colorado State University and is a frequent contributor to Livestock Wx, the U.S. Drought Monitor and tracks all things climate around Colorado.
All Posts