
County Precipitation Analysis Tool
How to Use the County Precipitation Tool
It’s a pretty common practice to refer to climatological variables, such as temperature and precipitation, by their averages. For precipitation, however, the average usually does not represent the most commonly occurring precipitation events. The average doesn’t actually happen very often. In fact, during the dry season, it’s pretty easy to have a below average precipitation month or two. For many locations and times of year, having below average precipitation is more common than having near or above average precipitation.
The County Precipitation Tool basically gives the odds of having too much or too little precipitation for a given county based on data collected by NOAA going back to 1895. Understanding the odds can help of course assess your risk of being short on precipitation at key times of the year. The Tool was developed for Livestock Wx by Dr. Becky Bolinger at Colorado State University.
Choose your STATE/COUNTY and which MONTHS you would like to see how often precipitation has deviated from normal.
If you want to estimate how likely precipitation will be less than or greater than average in the next month or season set the month ahead. In the below example, we looked at precipitation for Mar-Apr-May by choosing the MONTH as May and setting the timeframe to 3 MONTHS.
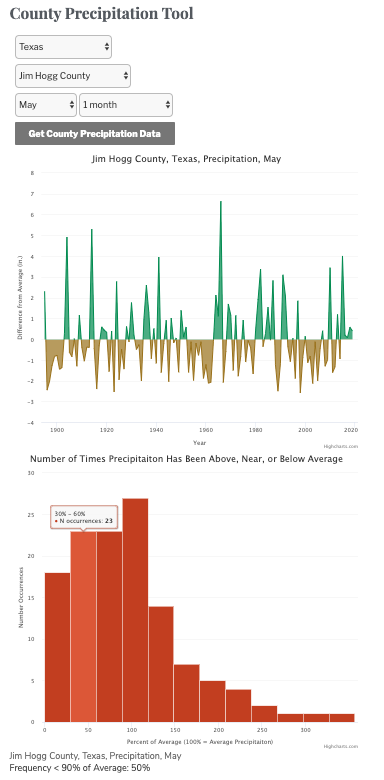
You can also see how many times precipitation has been less than 90% of average. In this example, Wilbarger county usually gets 8.3″ in Mar-Apr-May but there is over 40% chance they will receive less than 7.47″.