Livestock Wx
Forage Production in 2020, A Mixed Bag
- livestockwx
- June 1, 2020
- 8:32 pm
The latest forage production outlook was released last week from USDA and its partners. The forage outlook, called Grass-Cast, shows three different forage production scenarios for the Great Plains (or at least most of the Plains) that could occur between now and August 31st. Those scenarios are based on whether we get above, near-average, or below average rainfall for the growing season. Production is in “pounds per acre of peak standing biomass”.
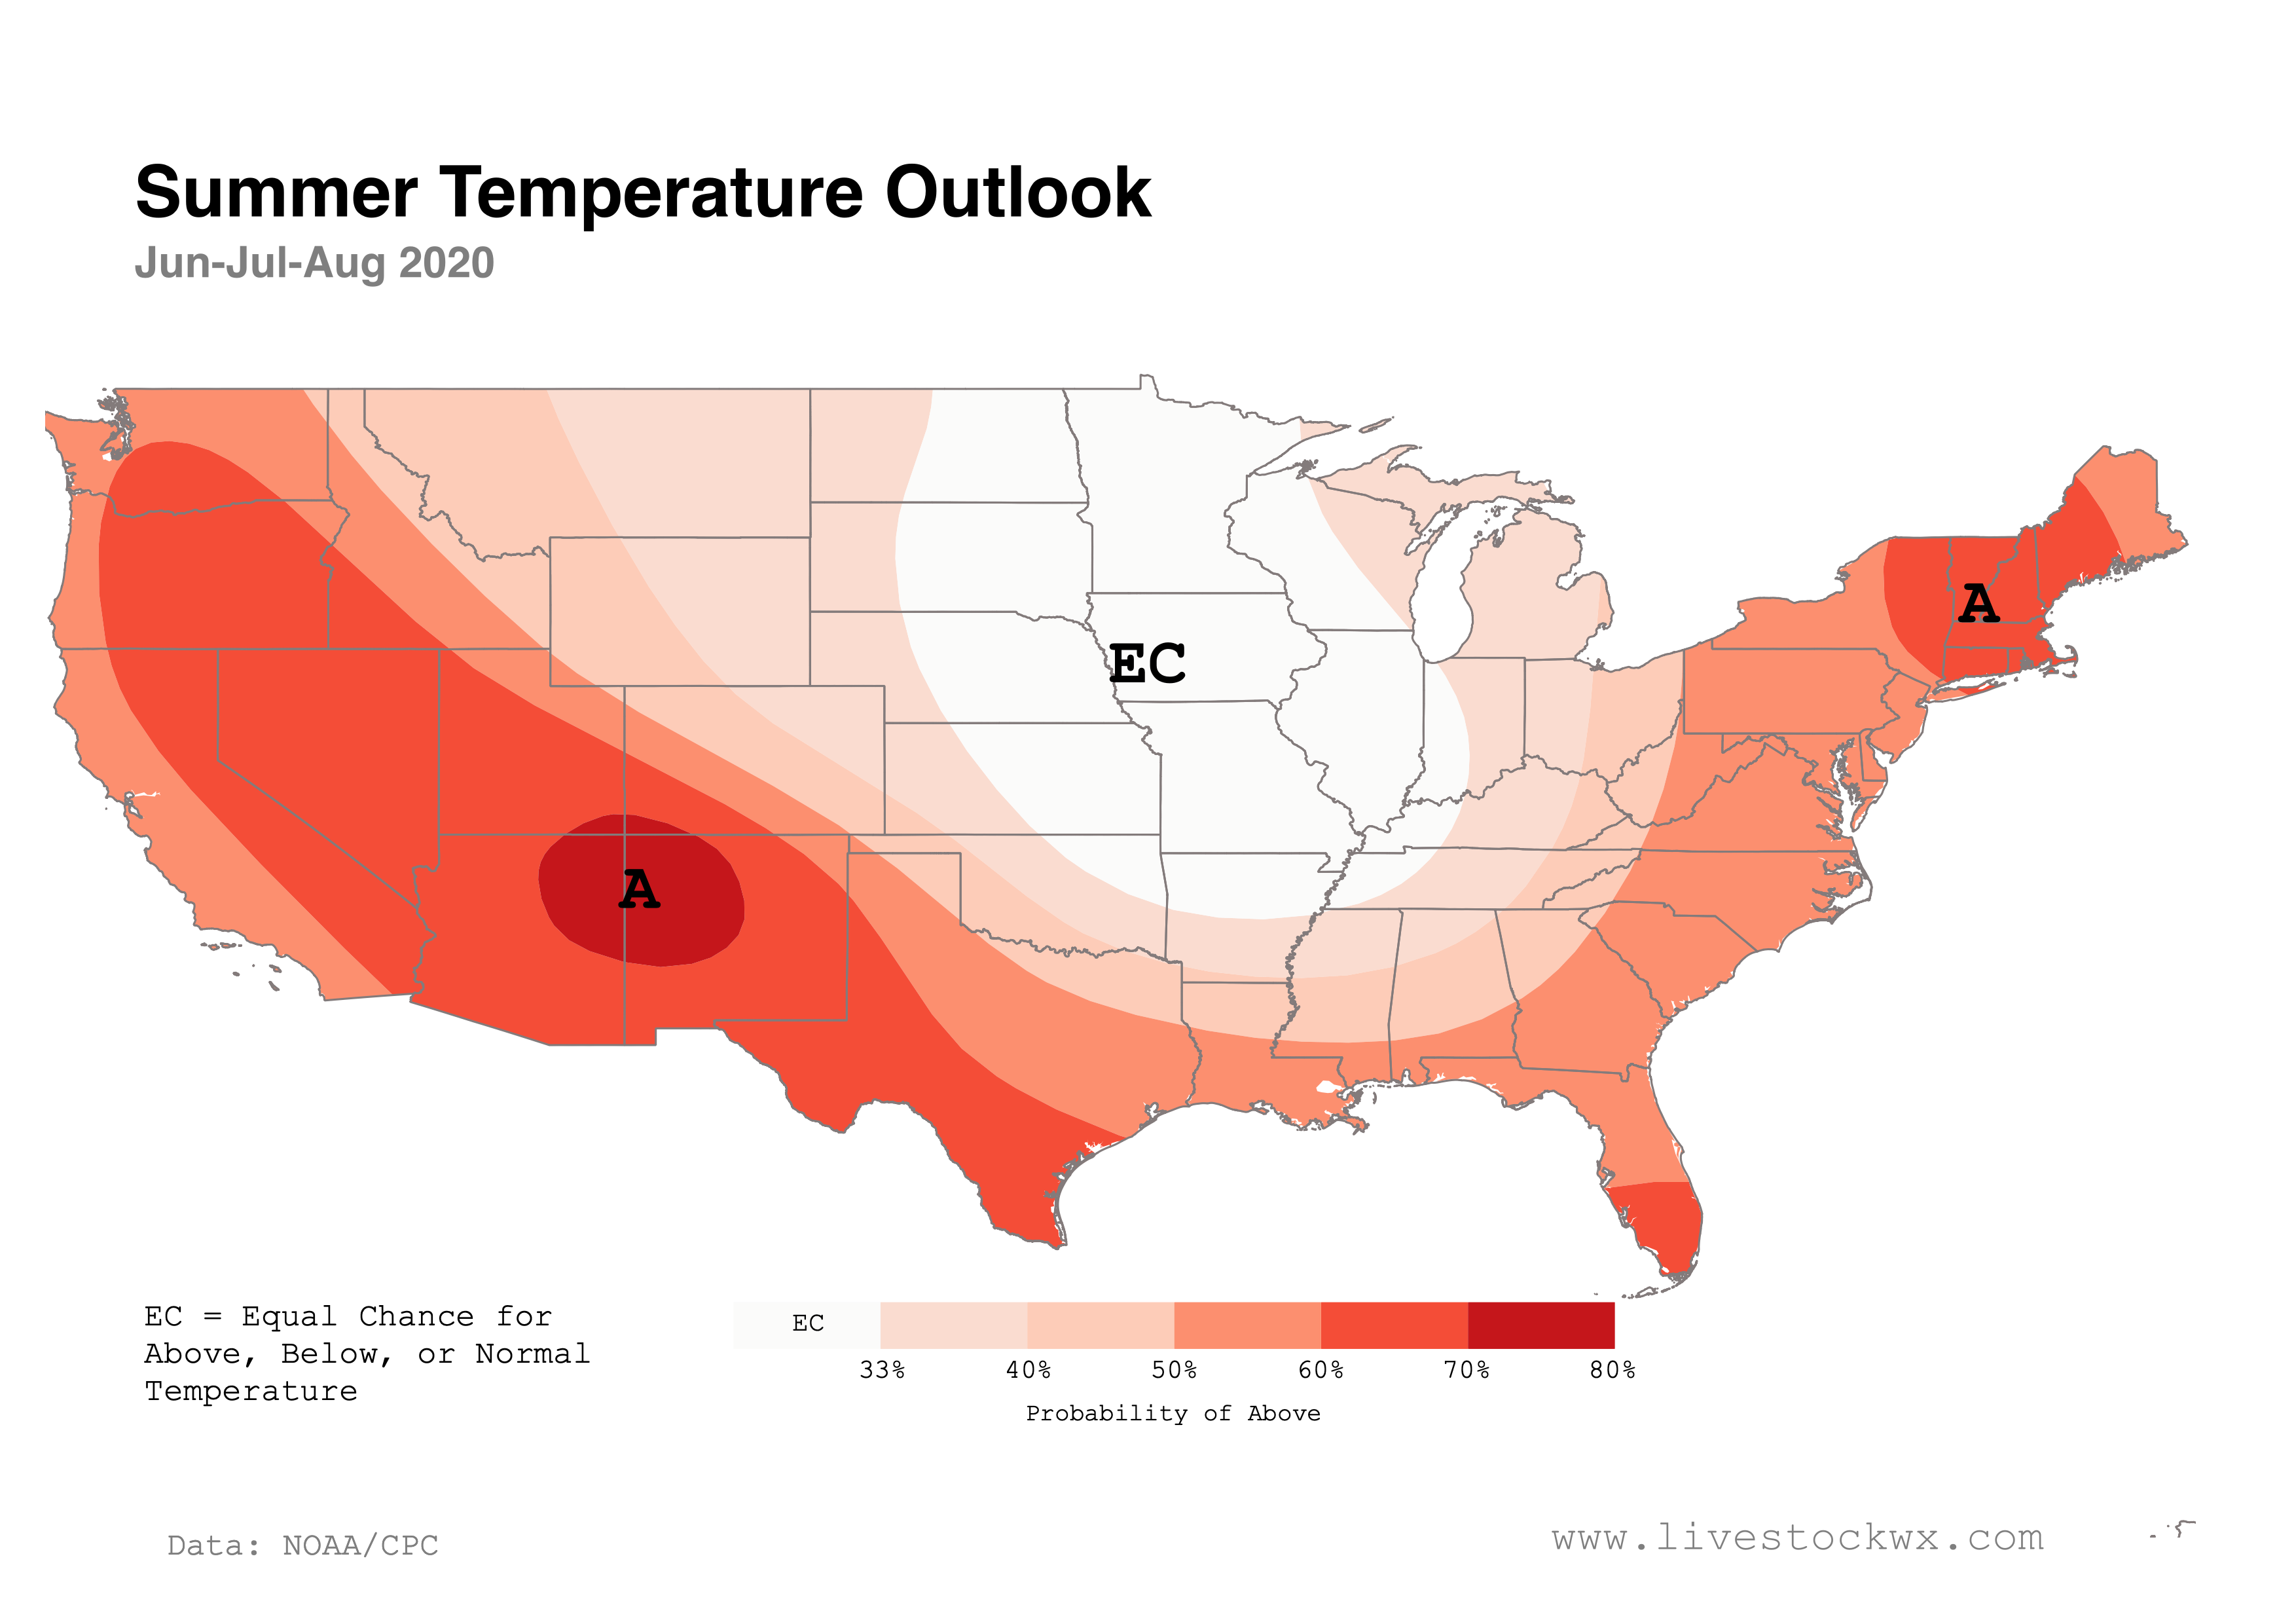
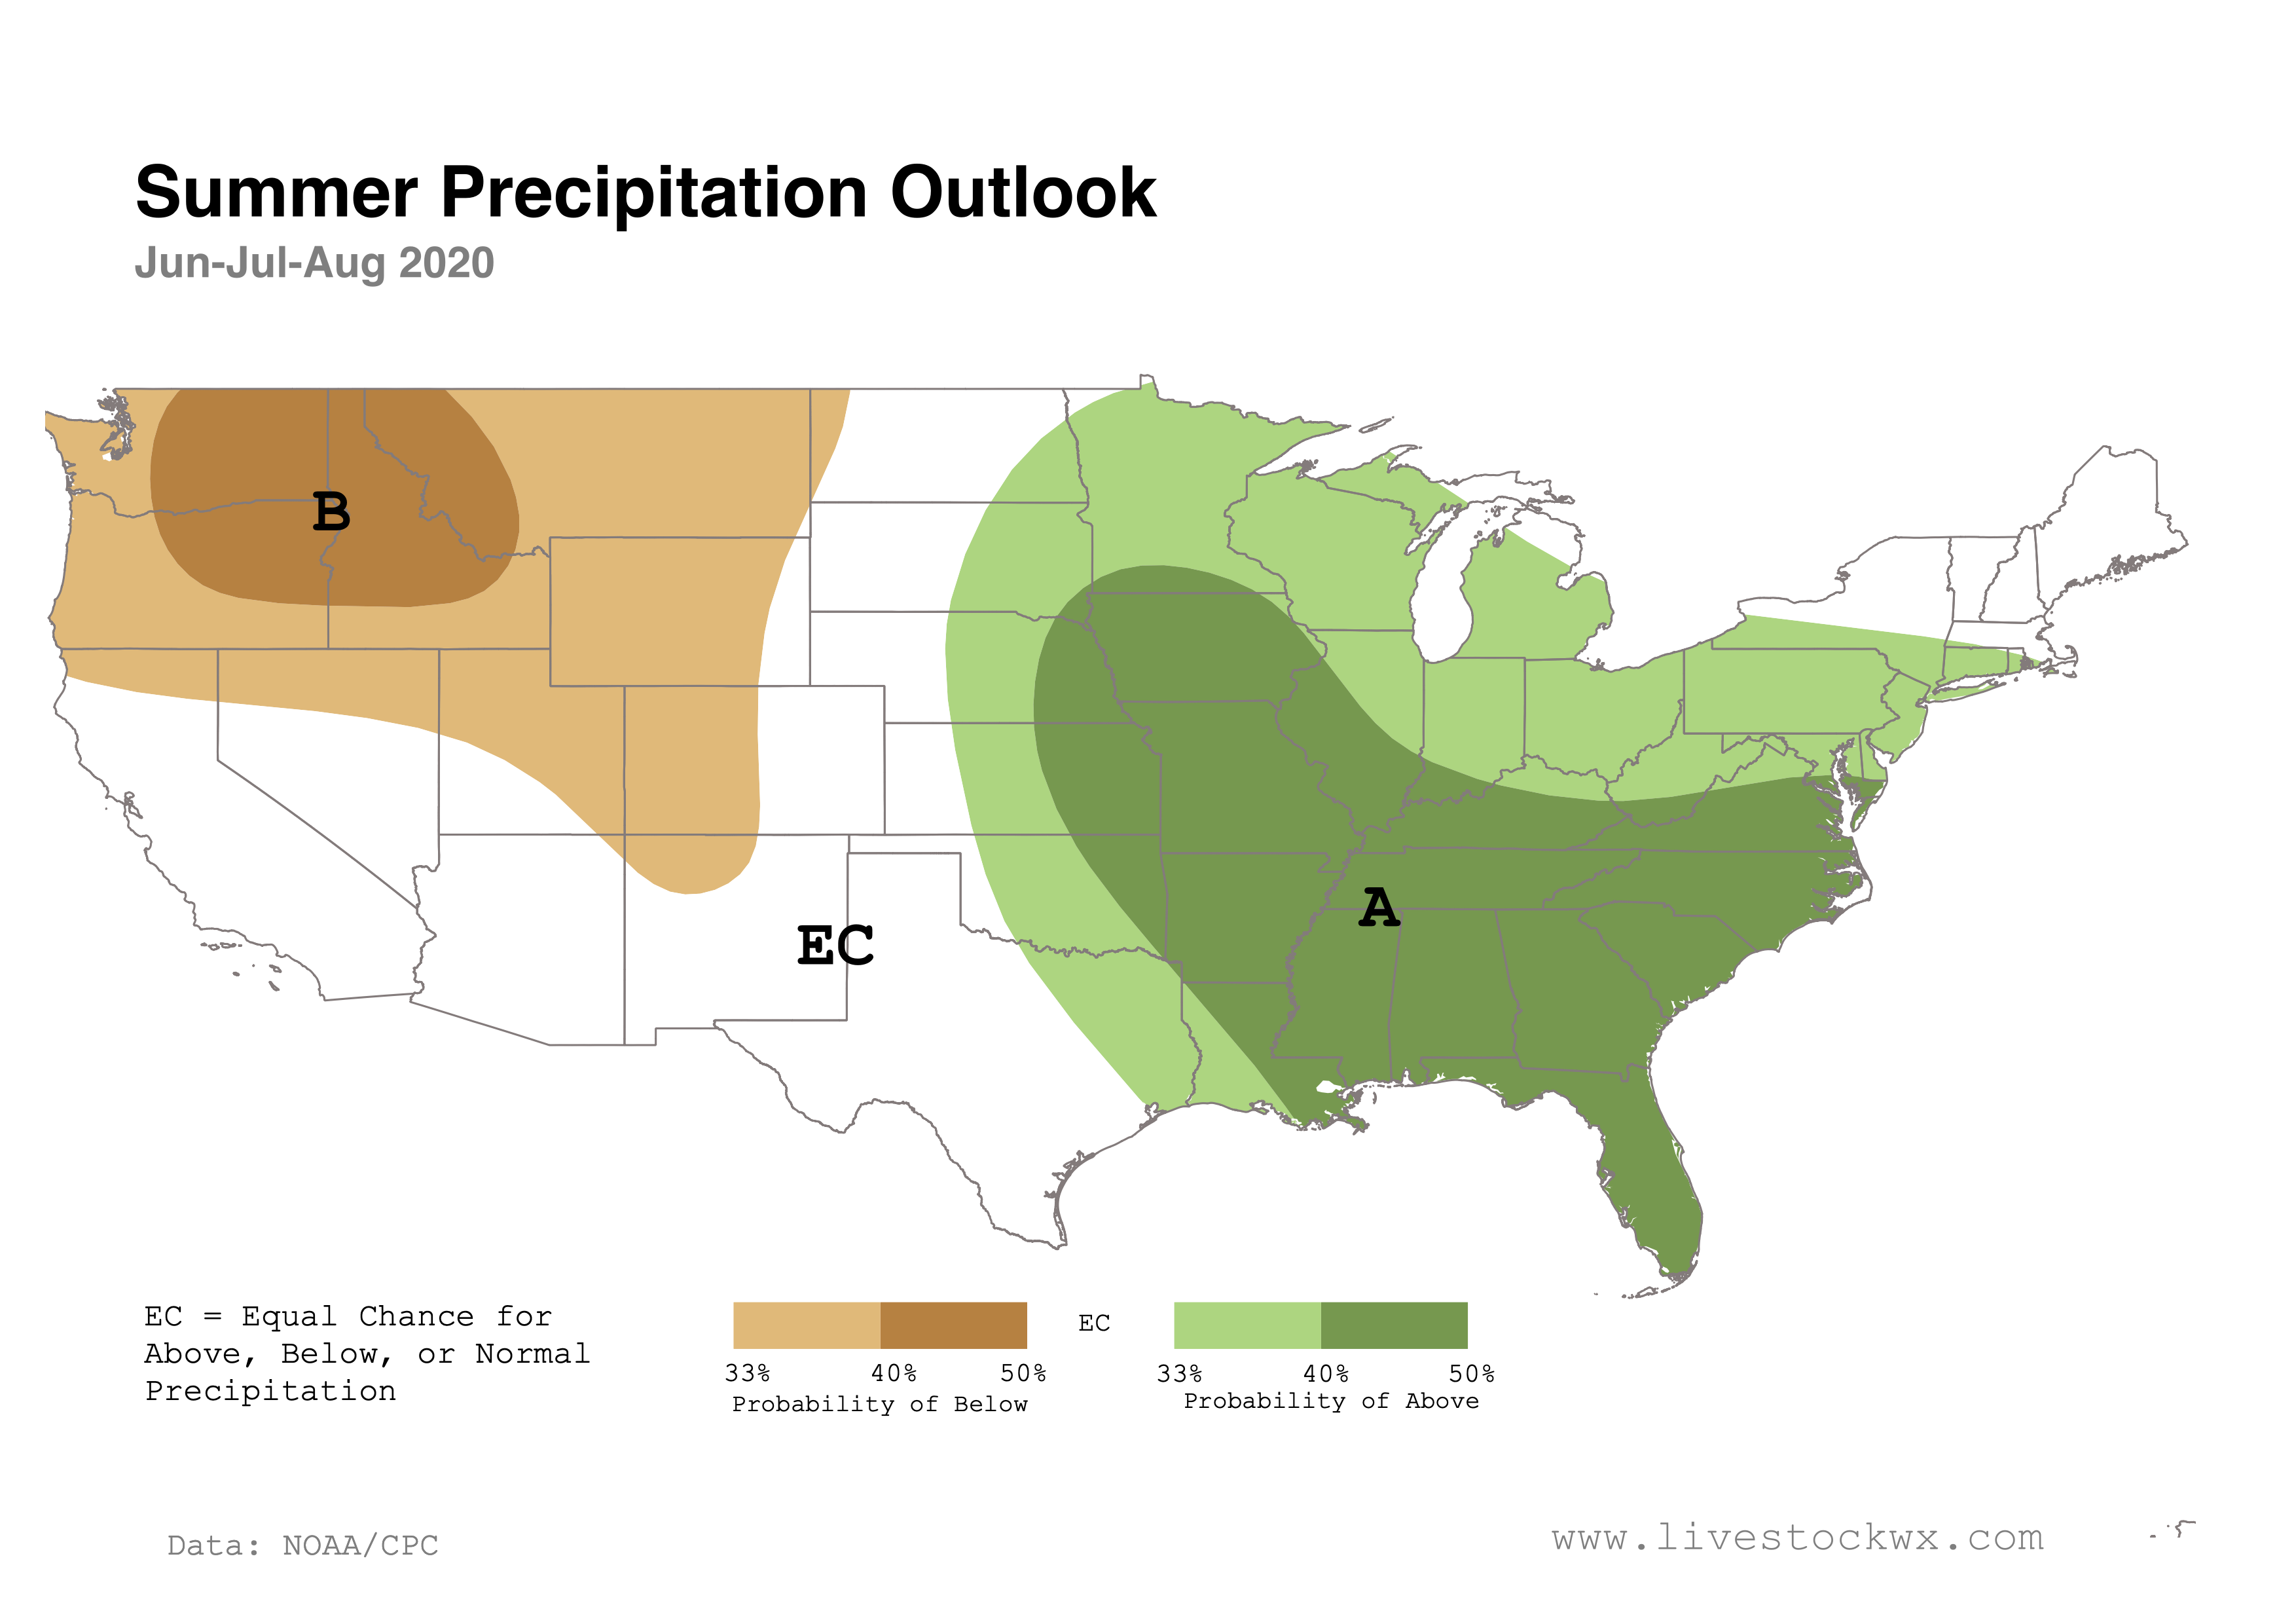
Grass-Cast is designed to be used with NOAA’s Temperature and Precipitation Seasonal Outlooks. The latest outlook maps for June-July-August are below. As you can see the odds are tilted for a warm summer for most of the country. Precipitation on the other hand–and the more challenging forecast to make–is favoring dry conditions in parts of the West and Pacific Northwest, and wet conditions in the Midwest and East.
Forage Outlook
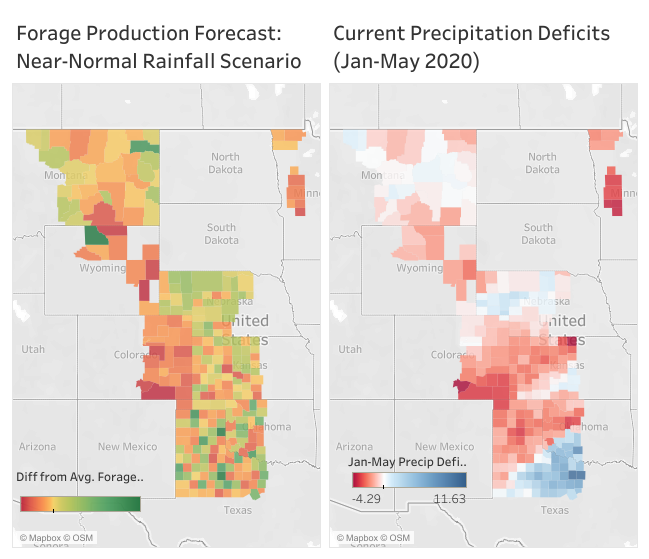
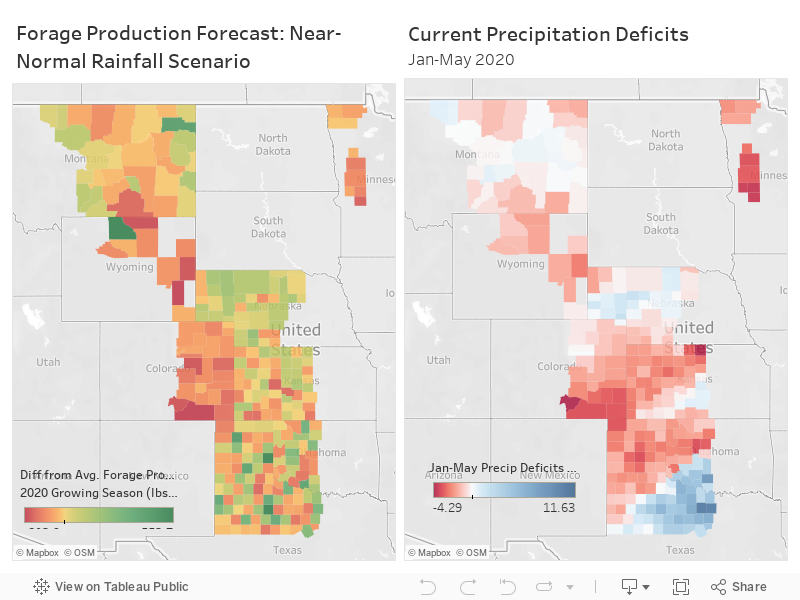
Parts of the Great Plains are seeing precipitation deficits going back to January and beyond. These deficits have been incorporated in the Grass-Cast Outlook, which is why two of the forage scenarios are showing reduced forage production for many counties this growing season. To give you an idea of what this looks like take a look at the interactive map for Near-Normal Precipitation forecast scenario. Areas in red or orange show reduced production even if rainfall is close to average for the rest of the summer. The second interactive map shows precipitation deficits for each county from January through May and hopefully will give you an idea of just how far below or above average you are for the calendar year.
Interactive Maps Showing the Forage Production Forecast if Precipitation is Near-Normal this Summer
Precipitation: Odds of Catching Up
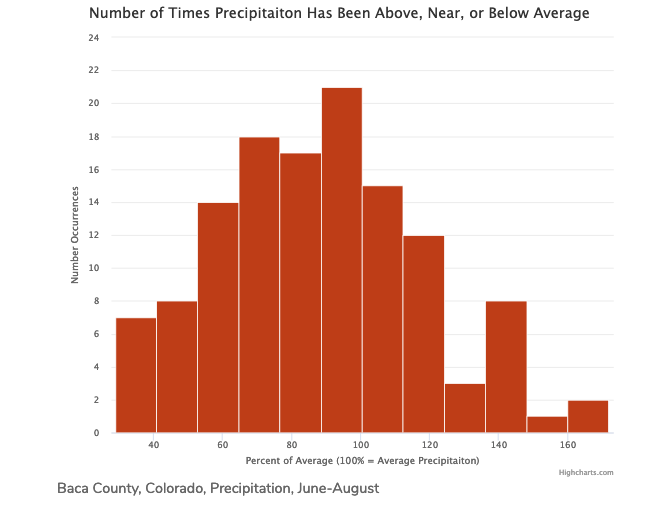
Looking at the current precipitation deficits, what are the odds we could see average or above average conditions for the rest of the summer using historical data going back to 1895? Thankfully we have a way to do that at the level of an individual county using the County Precipitation Analysis Tool that was developed by Dr. Becky Bolinger at Colorado State University. The graph on the right shows how frequently precipitation in June-July-August has been below or above average since 1895 using Baca County, Colorado as an example. Since 1895, summer precipitation in Baca County has been above average 41 times, or about 33% of the time, since 1895. So, Baca County has a one-third chance of at least getting to average precipitation, which using the Grass-Cast scenario of Near-Normal means forage production could be reduced by about 20% from average conditions. Not a great outlook for Baca County. They have been in a precipitation hole for sometime and will take an extraordinary summer to get them out of it.
For those in the area covered by the Grass-Cast Outlook and would like to see how likely your county could see average or above-average precipitation this summer we have provided the County Precipitation Analysis Tool below. To do the analysis similar to the example, choose your state and county. For the month choose August and for the number of months choose 3-months. That will show a frequency distribution of precipitation from June-July-August for your county from 1895 to present.