Livestock Wx
2020 Summer Outlook
- livestockwx
- May 26, 2020
- 9:00 pm
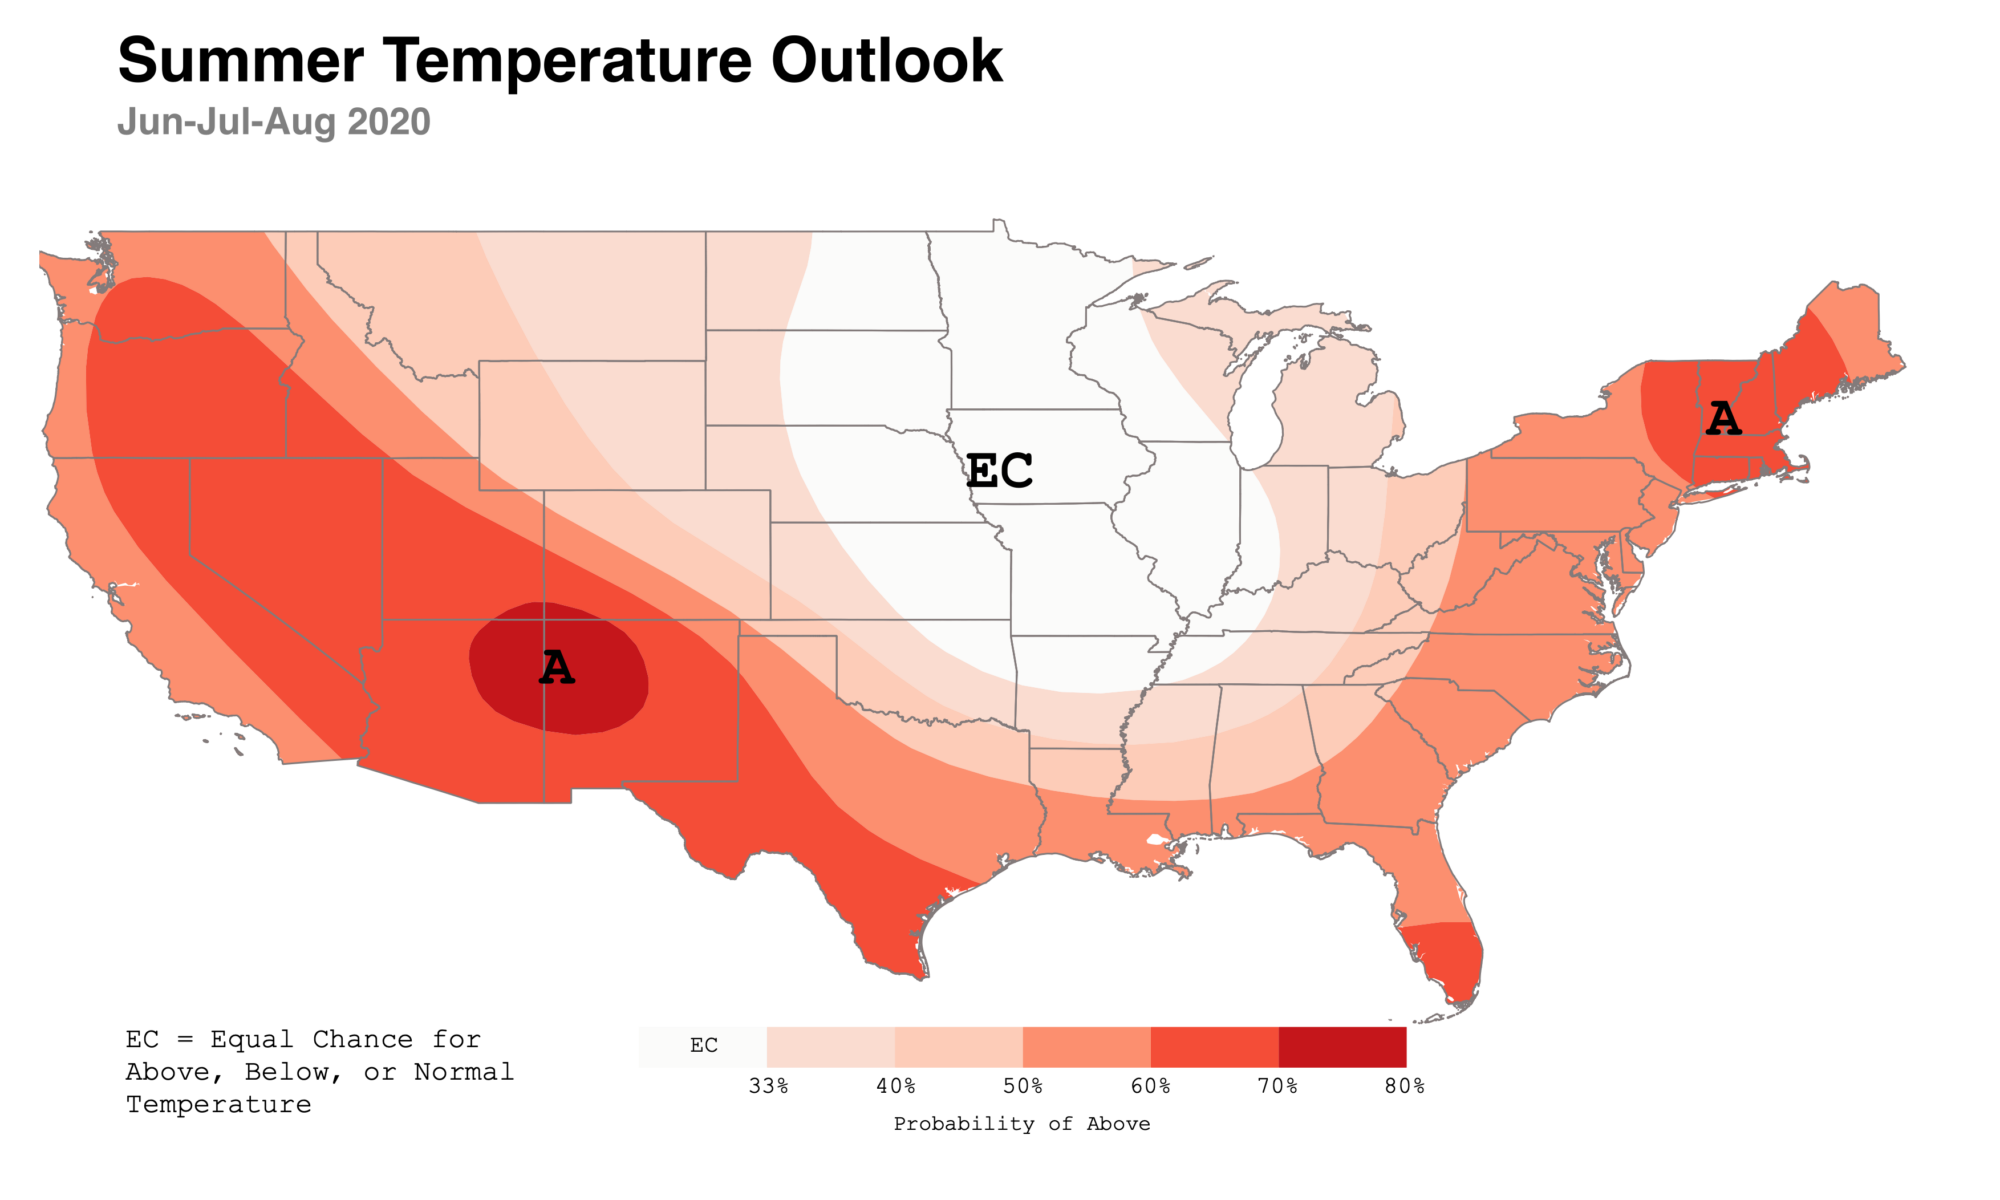
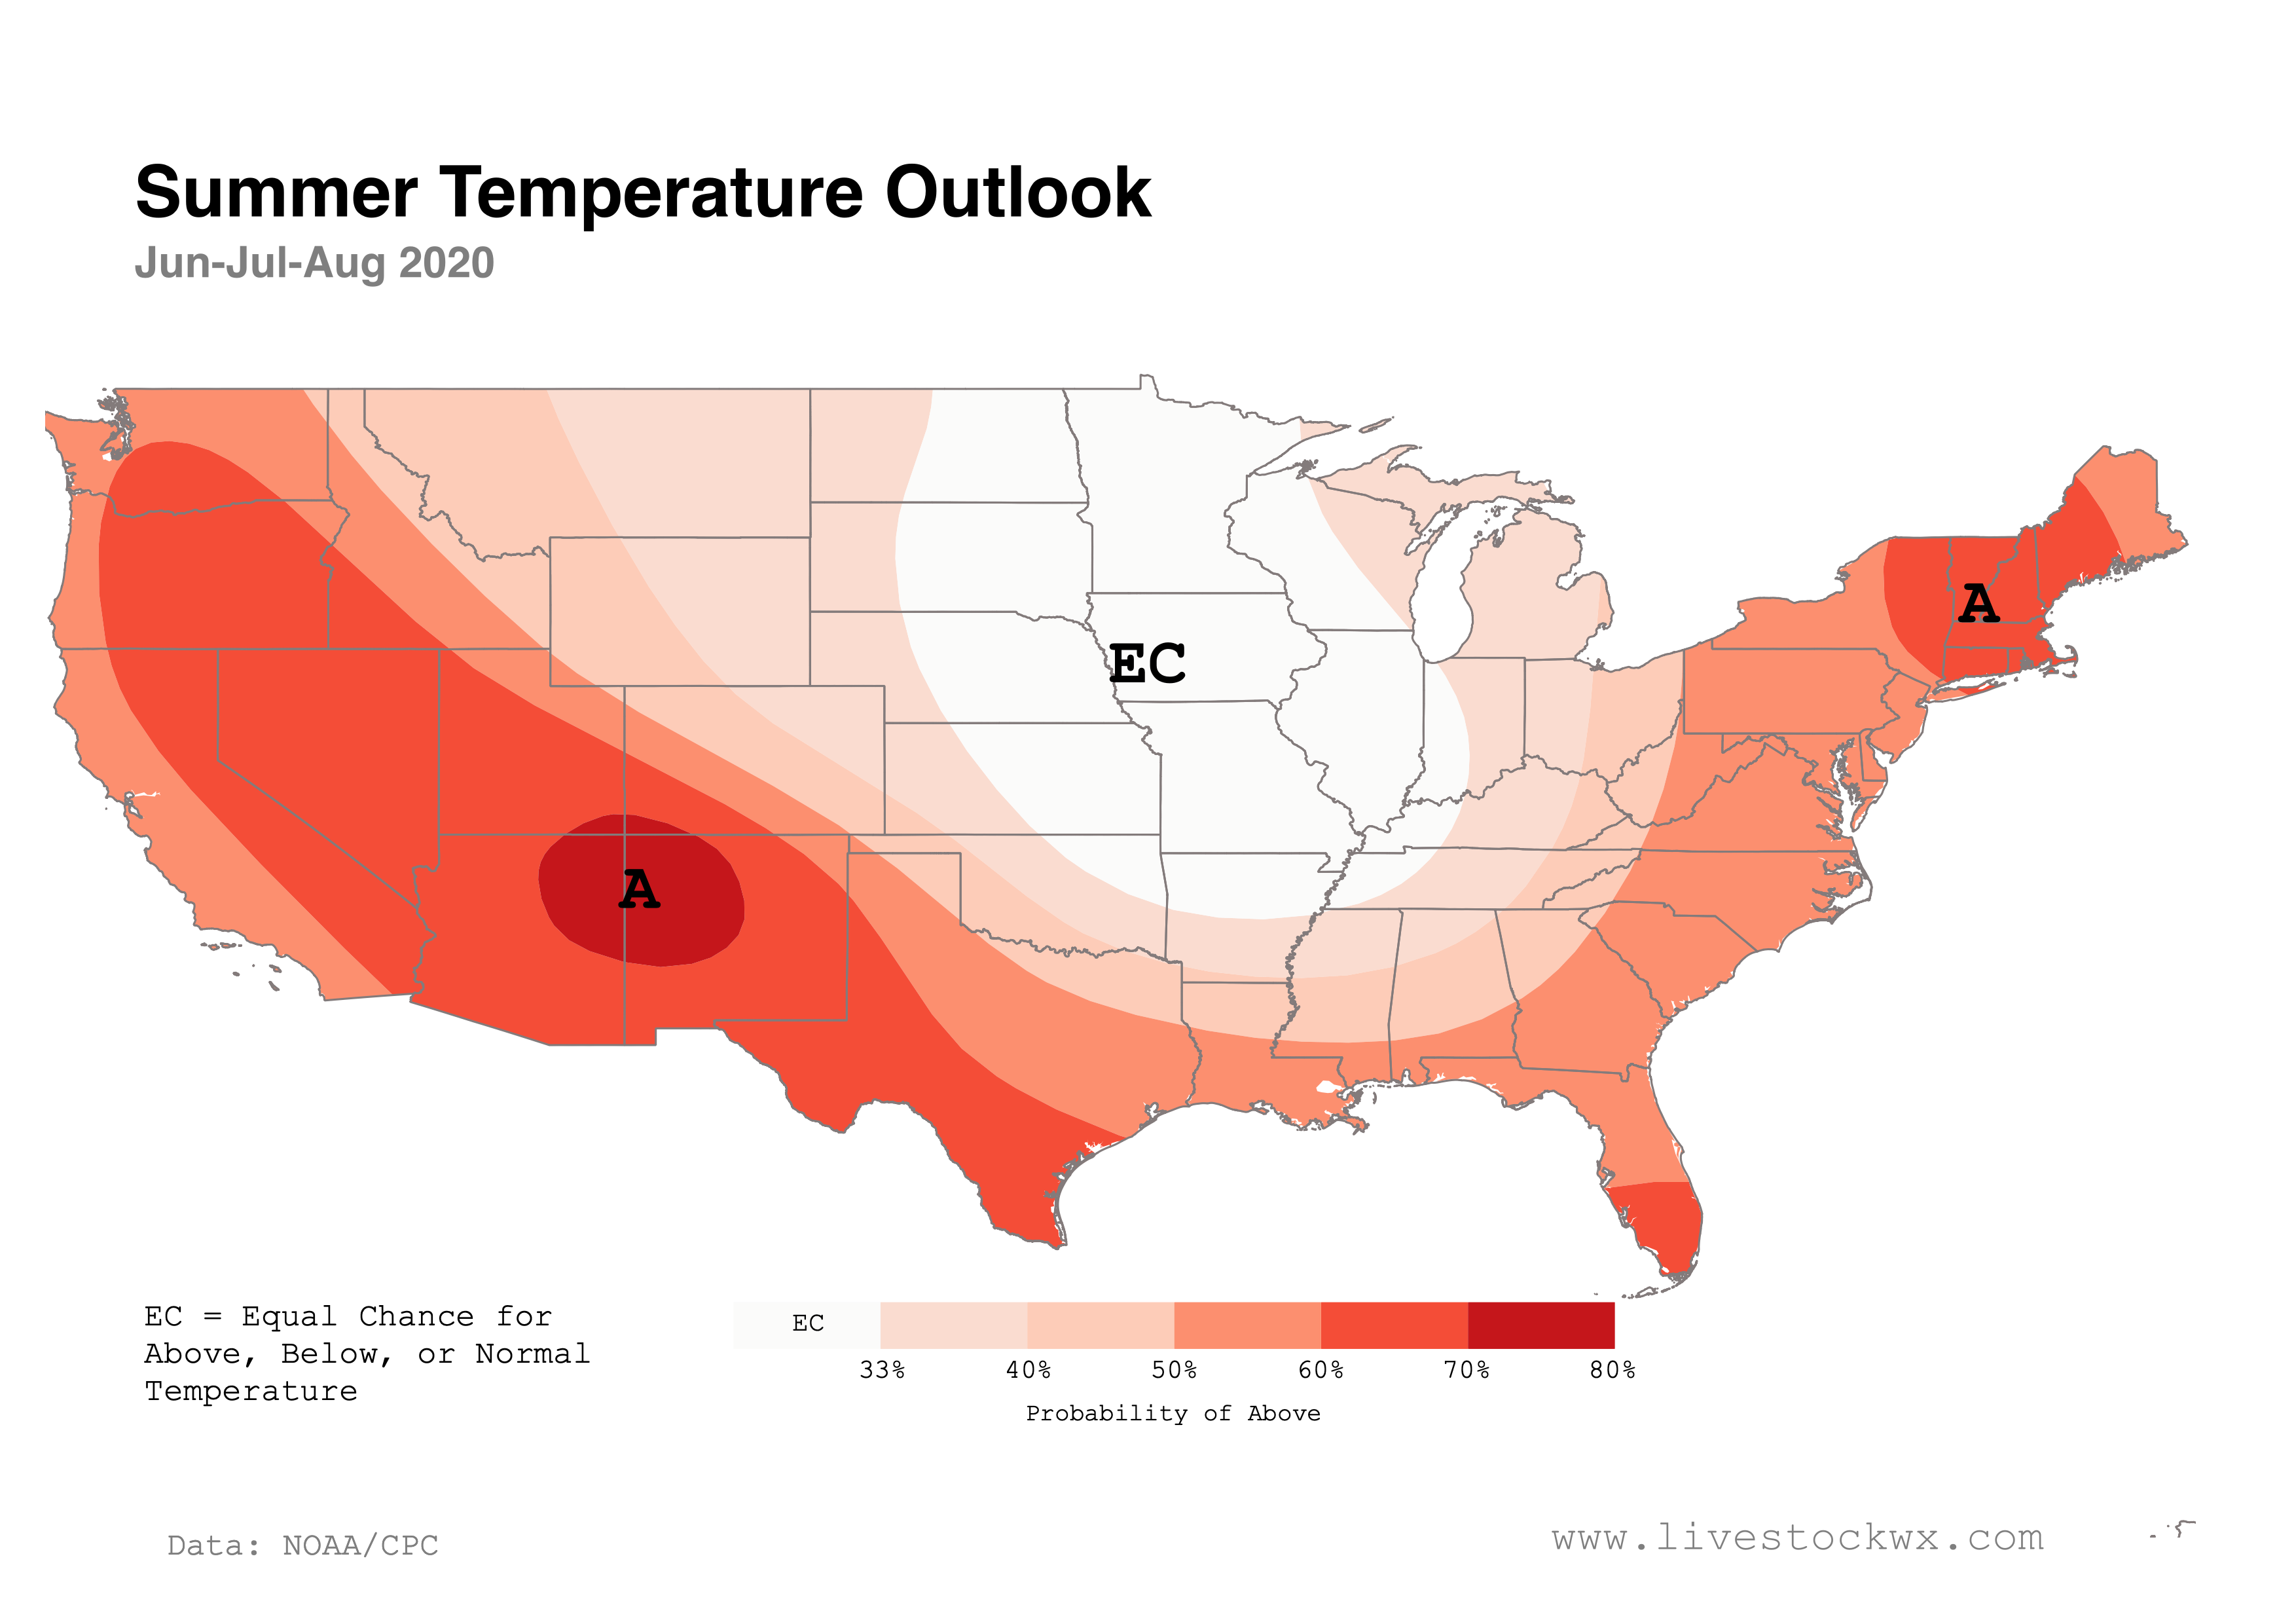
The 2020 Summer Temperature Outlook (Jun-Jul-Aug) is indicating fairly high probabilities of above-normal temperatures for a large part of the U.S. Parts of the West, states along the Gulf Coast, and the East Coast have a 60-70% chance of seeing hotter than normal temperatures this summer. The largest probabilities (above 70 percent) are centered over the Four Corners region due to forecast models picking up on a reduced precipitation trend in the area and declining soil moisture conditions. Equal Chances of below-, near-, or above-normal temperatures are forecast from the upper to middle Mississippi Valley along with parts of the northern to central Great Plains.
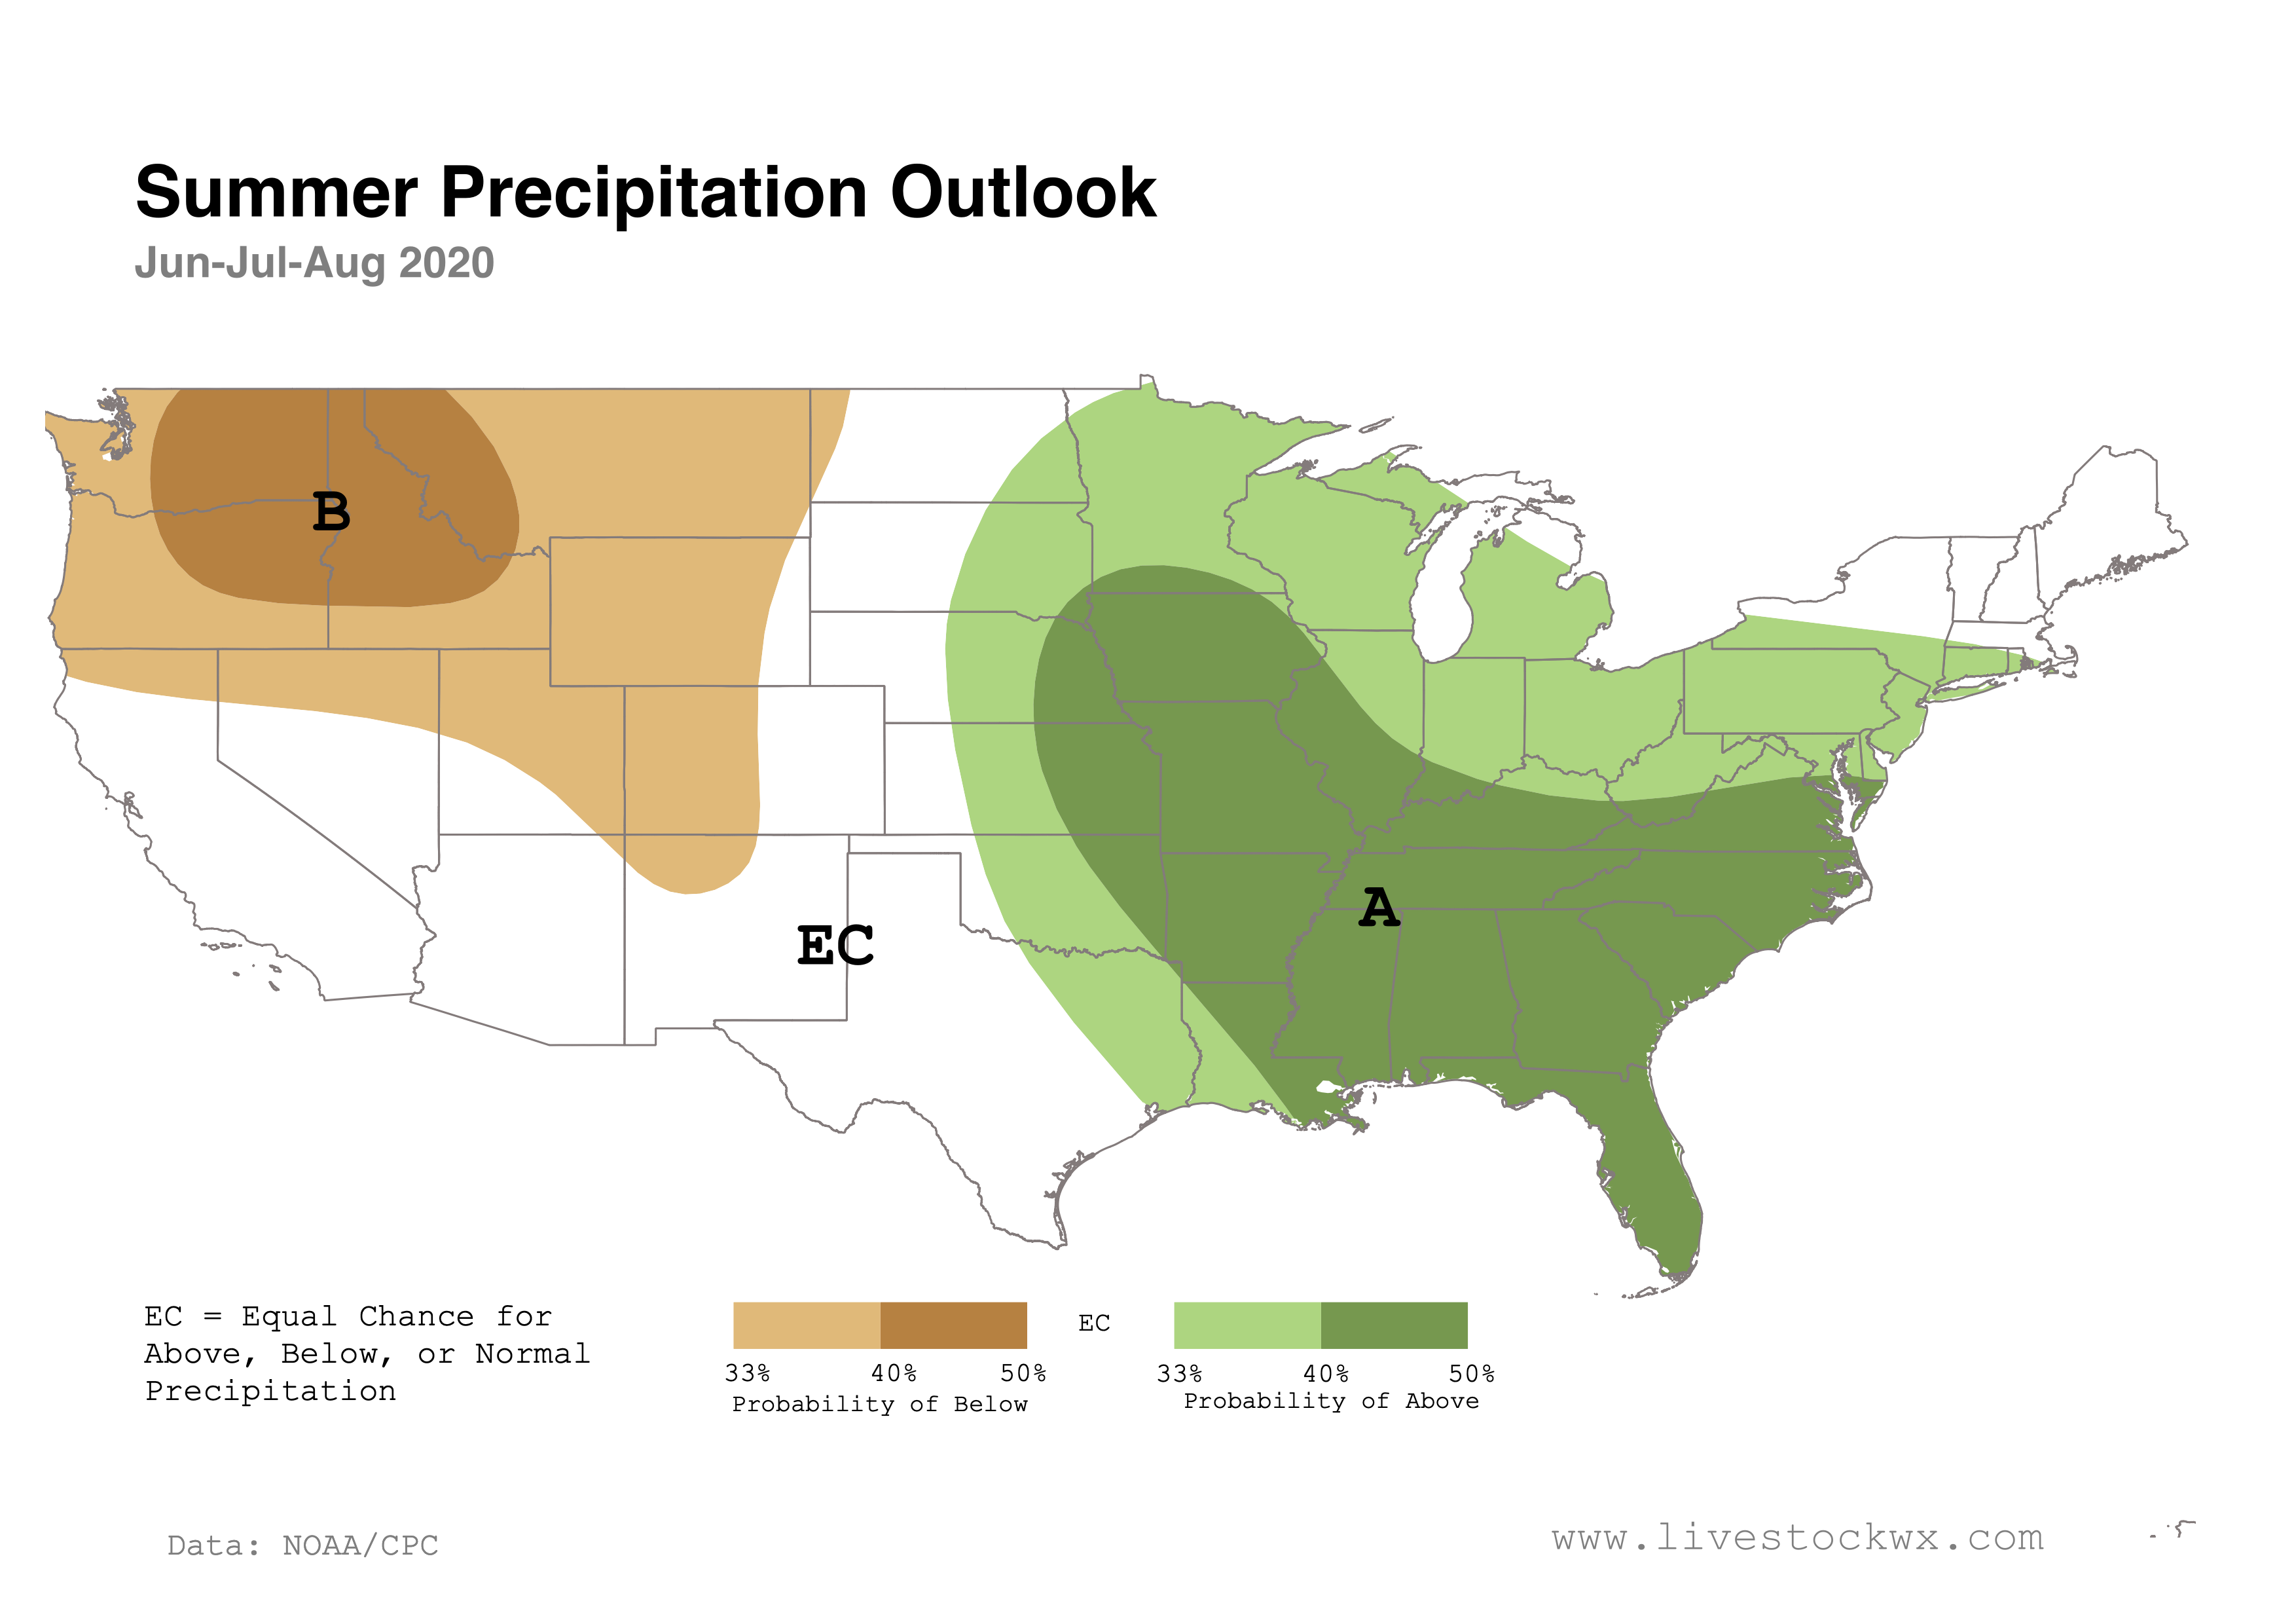
Summer Precipitation
The Summer Precipitation Outlook shows a tilt in the odds of above normal precipitation for much of the eastern and central U.S., while below-normal precipitation is more likely across the Pacific Northwest, northern Great Basin, and much of the Rockies. While the odds of reduced precipitation are not solid, the model results are nevertheless troubling given the ongoing drought in parts of Colorado, New Mexico, Utah, Nevada, and the West Coast.
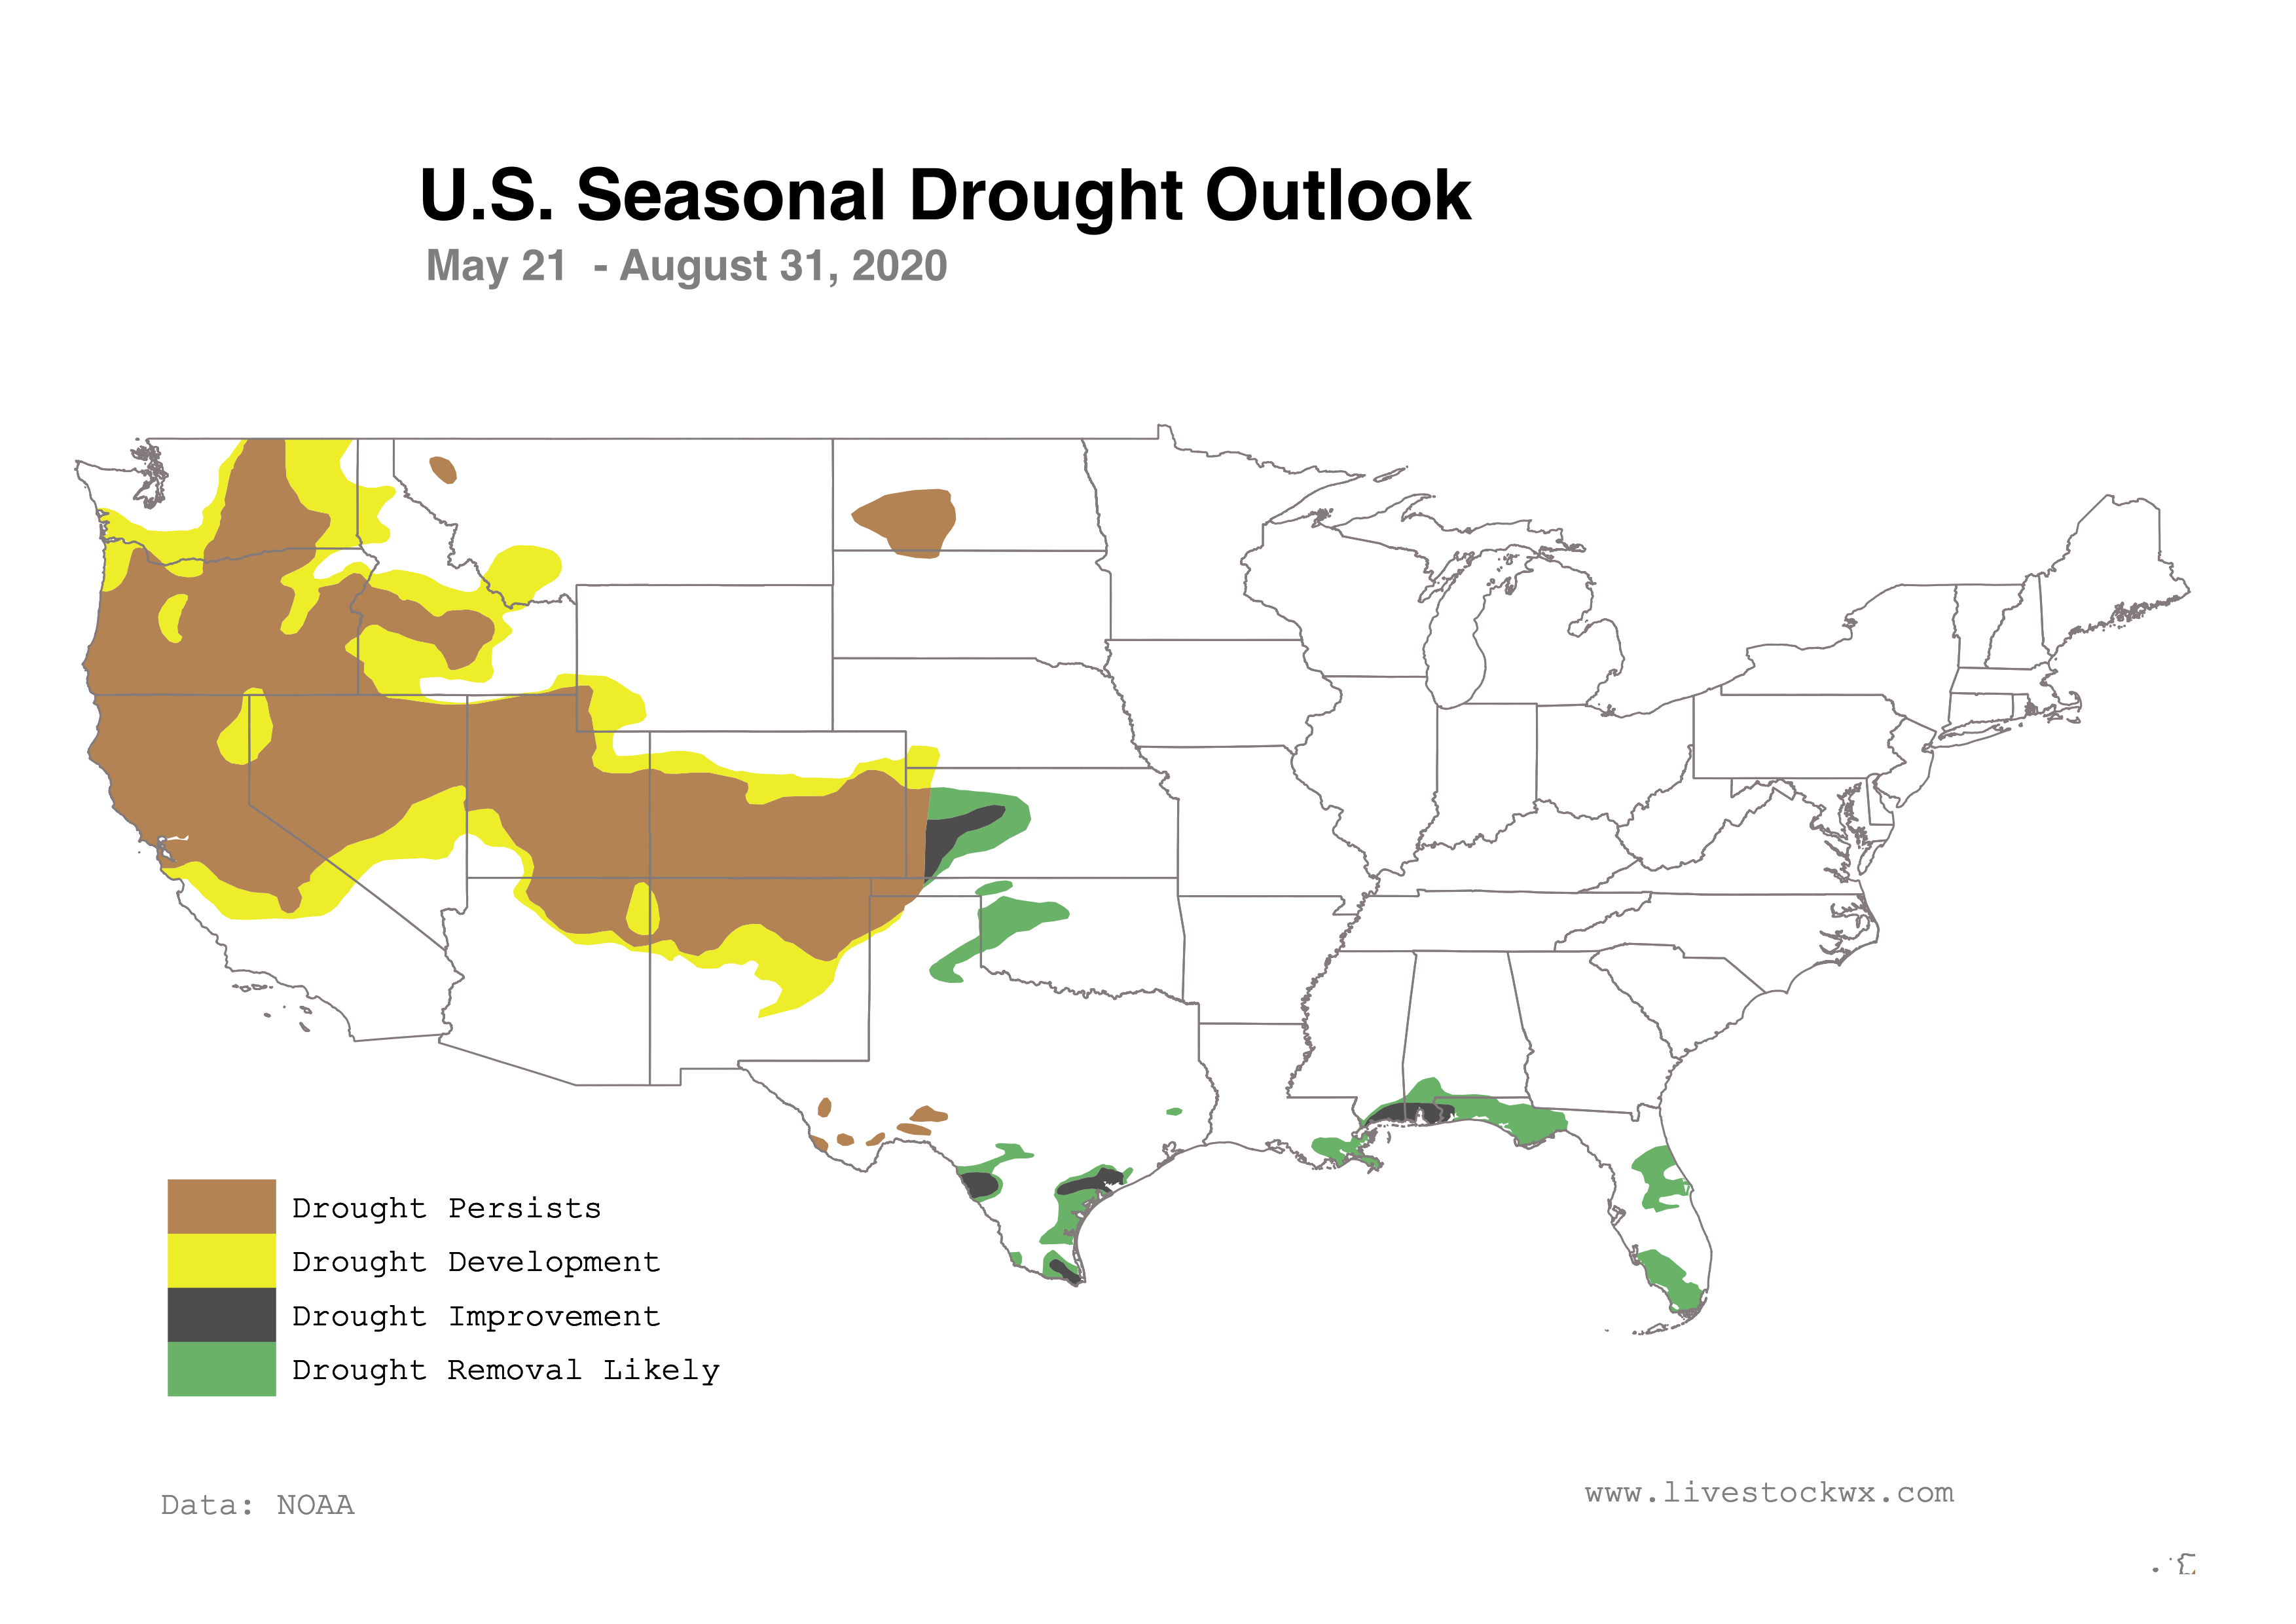
Drought Outlook for Jun-Jul-Aug
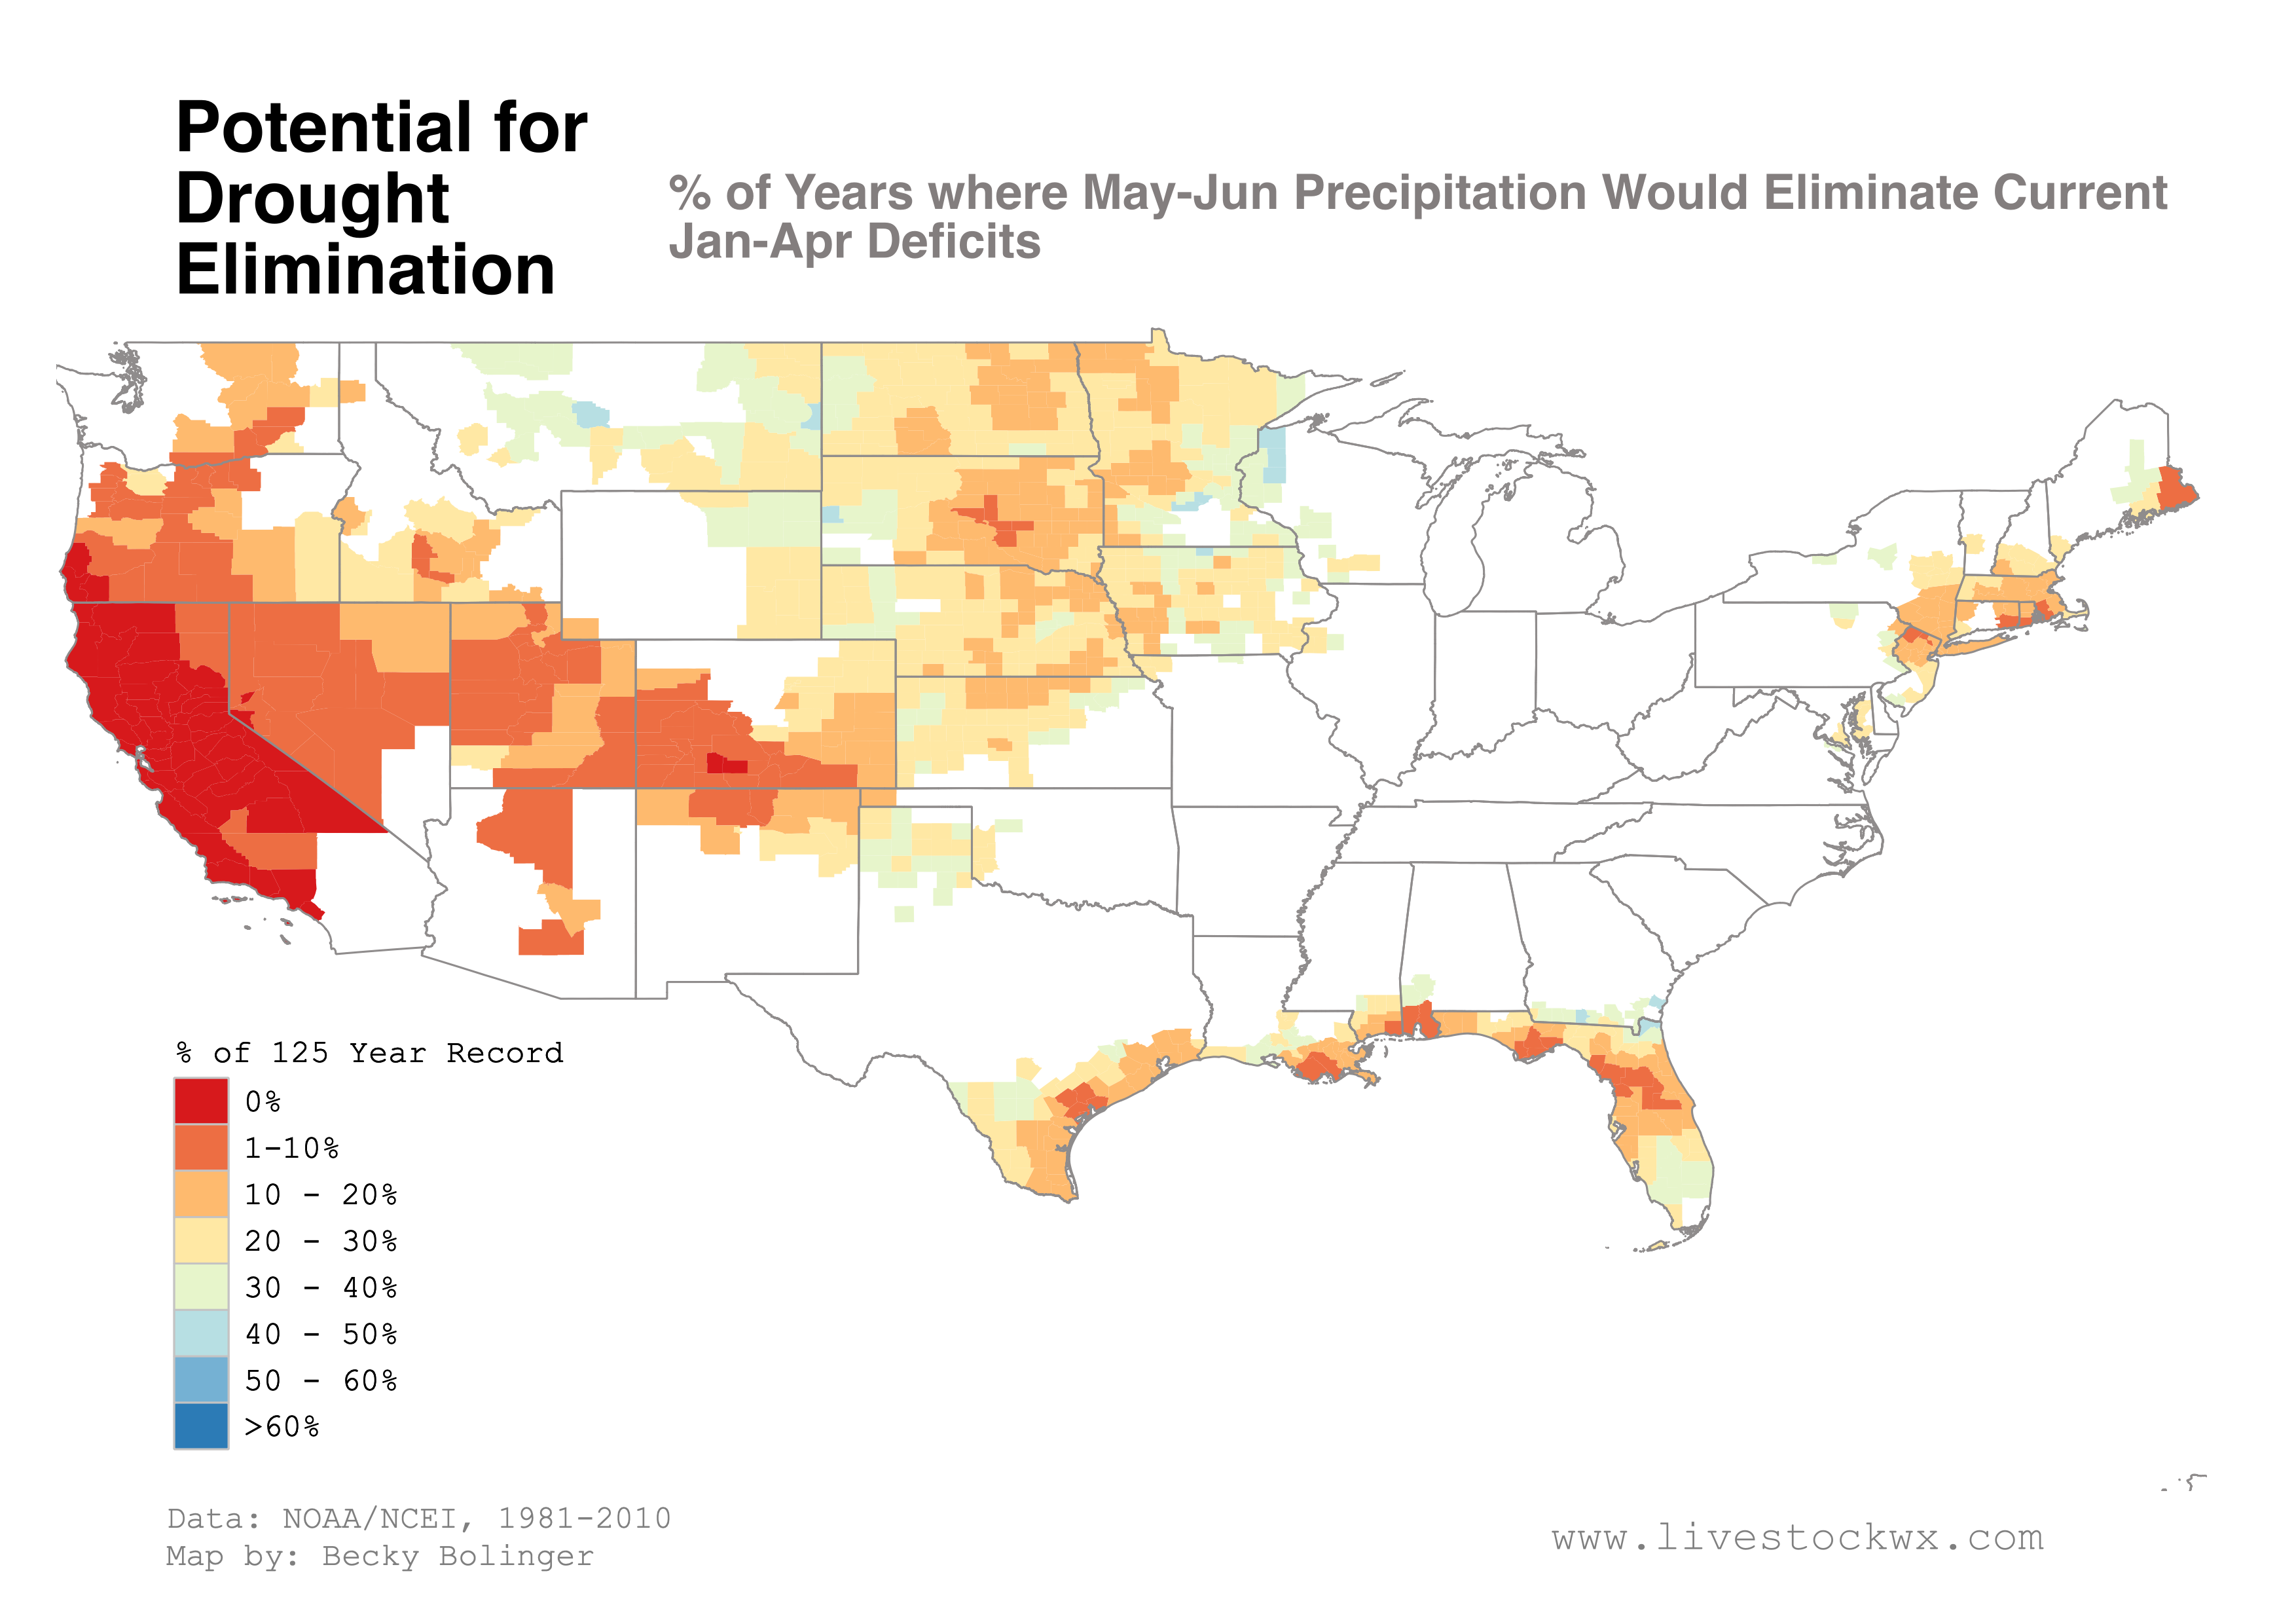
With the beginning of the May-June dry season in the West (see the article from Becky Bolinger on the prospects of coming out of a drought during the dry season) it is not looking good for drought improvement in the region. The precipitation and temperature forecasts and outlooks shown above are indicating the current drought will persist over the next three months and could expand in the Pacific Northwest, the Northern Intermountain Region, parts of central California and the Central Great Basin, which is shown in the latest Seasonal Drought Outlook below.
On the brighter side, drought removal or improvement is expected for parts of the Central and Southern High Plains. The wet season in full swing in some of these areas and it could be a huge help to improve soil moisture conditions in areas that have been very dry for the last several months. For the areas of drought near the Gulf Coast, nearly all official precipitation outlooks favor drought removal for most areas.