By the Numbers for the Week of April 22, 2019

By the N#mbers

By the N#mbers for the Week of April 22, 2019: May-June-July Seasonal Outlooks

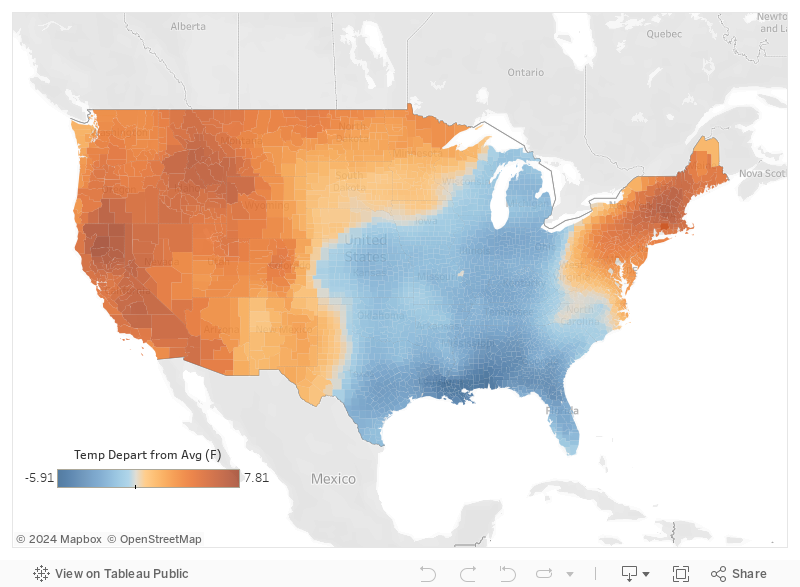
  • 33%-40% Chance of Below Normal Temperatures

    On Thursday, April 18, NOAA released its Seasonal Temperature and Precipitation Outlooks. The Outlooks cover May-June-July, or as is said in the biz, “MJJ”. Temperatures are expected to be cooler than normal over the Southern Plains, whereas the rest of the nation is expected to be warmer than normal. The Outlooks are keying on climatological patterns observed during El Niño years, which is partly why they are showing below normal temps from Nebraska down to Texas.

May-June-July Temperature Outlook
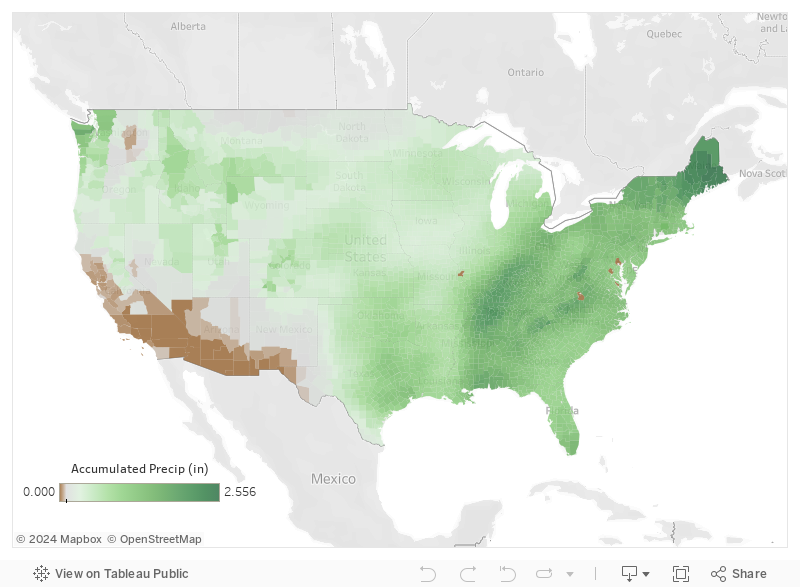
  • 40%-50% Chance of Above Normal Rainfall

    Just like the Outlook for Temperature, expectations for precipitation are mostly aligned with what we normally expect during an El Niño. Over the next three-months lookout for above-normal rainfall over most of the country. The enhanced outlooks for rainfall are also associated with current positive (wet) soil moisture anomalies over the Plains. It will be interesting if the percentage of drought continues to decline across the U.S. As many know, the summer is usually when it ramps up so it should be an interesting next three-months.

May-June-July Precipitation Outlook
  • 3% Decline in March Cattle Marketings

    The April Cattle on Feed report shows 1.78 million head of cattle were marketed in March, a 3% decline of marketings compared to 2018 numbers. It’s easy to see how the colder than normal temperatures combined with above average precipitation in major cattle feeding locations could’ve have put a damper on March marketing numbers.

  • Top 100

    Looking at the most recent climate rankings, many regions around Texas were inside the top 100 years (Remember these rankings consider the last 125 years) for precipitation for the period of October through March. The TX High Plains (includes the Panhandle) was the 104th wettest, the Low Rolling Plains 113th, North Central was 119th, the Trans Pecos was 100th, and the Edwards Plateau was 113th. That explains how we were looking dry way back in December-January in the Panhandle and surrounding areas and then all of a sudden, the drought was gone, and South Texas took it over.

  • 3% Drought and on the Decline?

    The U.S. drought area continues to take a pounding. This week, just like last week, set a record for the lowest percentage of the Contiguous U.S. in drought at just a little over 3%. We’re rooting for something south of 1% but we’re also mindful many areas don’t need any more precipitation and are looking forward to planting and turning out their cattle.

Share on facebook
Share on google
Share on twitter
Share on linkedin
Share on pinterest

7-Day Temp & Precip Forecasts

7-Day Temp & Precip Forecasts

Temperature Anomaly Forecast: April 19-April 25

Accumulated Precipitation (in) Forecast: April 19-April 25

CATTLE DENSITIES & the 7-Day Temperature and Precipitation Forecasts: April 19-April 25

Large numbers (scaled circles) of cattle in the Central Plains will see COLDER (blue) and WETTER (green) than normal temperatures over the next 7-days.

Share on facebook
Share on google
Share on twitter
Share on linkedin
Share on pinterest

Drought Trends for April 16, 2019: Could see some Dryness Creep in around Southwest and Southeast U.S.

Drought Trends for April 16, 2019: Parts of the Southwest and Southeast Could See Drought Expansion Over the Next 15-Days

Two rapidly-moving strong storm systems brought severe weather and widespread precipitation to a good portion of the country.  Widespread rainfall and snow fell across Idaho, Montana, northeastern Nevada, Utah, and Wyoming. South Dakota observed very heavy snow of over 2ft. in some places. Moderate to heavy snows also blanketed Minnesota, Wisconsin, northern Michigan, and northern Illinois. In the Plains, moderate to heavy rains (1-3 inches) were measured in portion of Oklahoma and Texas, which then moved into the lower Mississippi and Tennessee Valleys. 

Very little precipitation fell on most of the Southwest.  For the Plain: the southern, central, and extreme northern Plains saw very little precipitation. Temperatures were mostly below-normal in the western two-thirds of the U.S., especially in the northern Plains and upper Midwest (6 to 12 degrees Fahrenheit below normal), and above-normal in the eastern third of the Nation (6 to 9 degrees Fahrenheit above normal).

For the contiguous U.S., drought decreased by about one percentage point.  There was a slight expansion of Abnormally Dry conditions in the Texas Coastal Plain, North Florida, and South Carolina.

1% Cattle in Drought

1% Hay in Drought

The percentage of corn, cattle, and hay that are considered in drought continues to decline.  This week finds 1% of cattle, 1% of hay, and 0% of corn in drought.  These percentages continue to be the lowest for all three since these stats started to be tracked in 2011.

Interactive chart showing cattle, hay, and corn areas in drought since 2011. The data are ranked from highest to lowest in drought. Mouse over the chart to see individual years.

Plot 40

Potential Areas of Drought Improvement and Deterioration

The below images show the current U.S. Drought Monitor and the 15-Accumulated Precipitation and 15-Day Potential Evapotranspiration Forecasts.  Potential Evaportranspiration, or PET, is the amount of evaporation that would occur if sufficient water is available.  Basically, you can think about it as the amount of water that could be evaporated from the soils and plants (if water was not limited, which is why it has “Potential” in the title).

The central to eastern portion of the U.S. will continue to see precipitation over the next 15-days.  Areas that could receive little precipitation and see high PET rates over the next 15-days are southern Georgia/northern Florida, and parts of the Southwest U.S.  These areas could see drought start to creep in or at least you might start see an expansion of yellows and oranges for these areas on the U.S. Drought Monitor.

April 6, 2019 U.S. Drought Monitor. Counties shaded in purple have cattle densities of 50K head or more.

15-Day accumulated precipitation forecast (green/brown) compared to the 15-Day Potential Evapotranspiration Forecast (red/gray) for the period of Apr 20 - May 04. Use your mouse to see data for individual counties.

Share on facebook
Share on google
Share on twitter
Share on linkedin
Share on pinterest