Drought Trends for June 11, 2019
- Chad McNutt
- June 14, 2019
- 2:22 pm
[Excerpt from the June 11th U.S. Drought Monitor]
This U.S. Drought Monitor week saw highly beneficial rainfall activity across drought-stricken areas of the Southeast. Across this region, locally heavy rainfall accumulations (ranging from 2 to 8+ inches) and localized flash flooding were observed. These soaking rains helped to significantly improve soil moisture as well as boost streamflow levels in some of the areas hardest hit by the recent heatwave. In parts of the Midwest, continued rains, flooding, and very moist soils delayed the planting of crops—including corn and soybeans. According to the USDA June 11th Weekly Weather and Crop Bulletin, “only 67% of the nation’s corn and 39% of the soybeans had been planted, breaking 1995 records of 77 and 40%, respectively.” In northern North Dakota, areas of drought expanded in relation to short-term precipitation deficits and reported impacts in the agricultural sector. Out West, drought intensified in the Idaho Panhandle where poor snowpack conditions during the 2018–19 season have led to below-normal snowmelt runoff conditions. Nationwide, May of 2019 was the 2nd wettest May on record for the contiguous U.S., according to NOAA’s National Center for Environmental Information (NCEI).
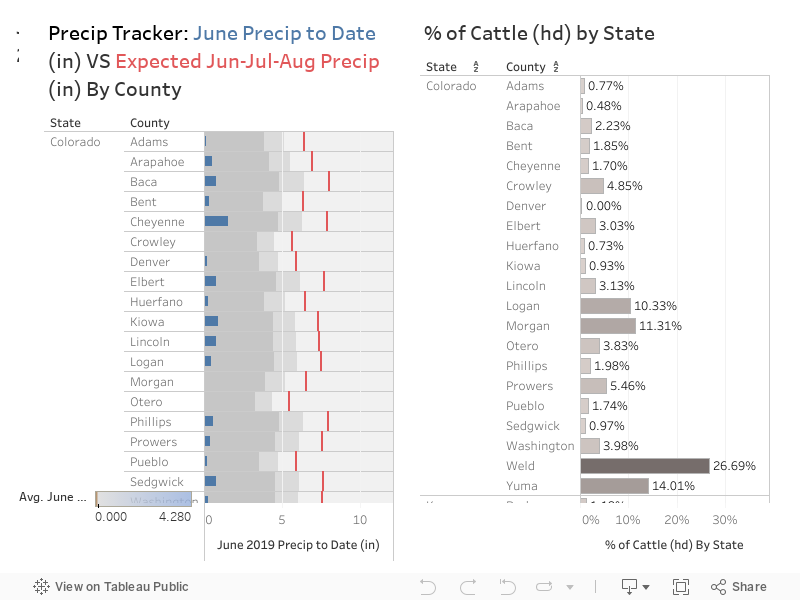
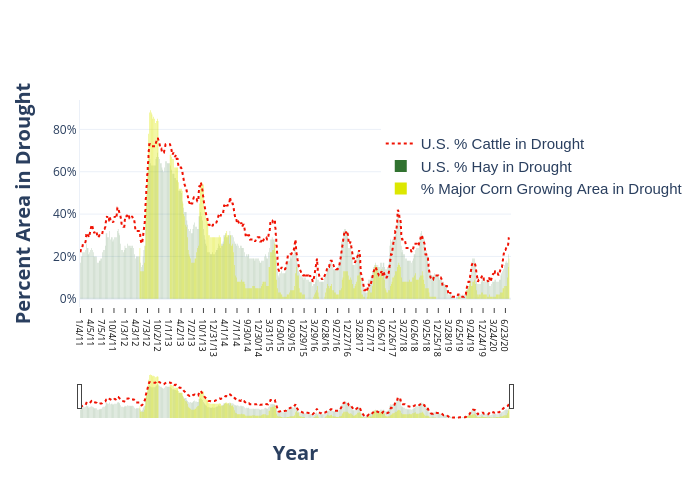
The percentage of cattle, corn, and hay in drought continues to remain low at 2% cattle, 2% hay, and 1% of corn areas considered in drought.
2% Cattle in Drought

2% Hay in Drought

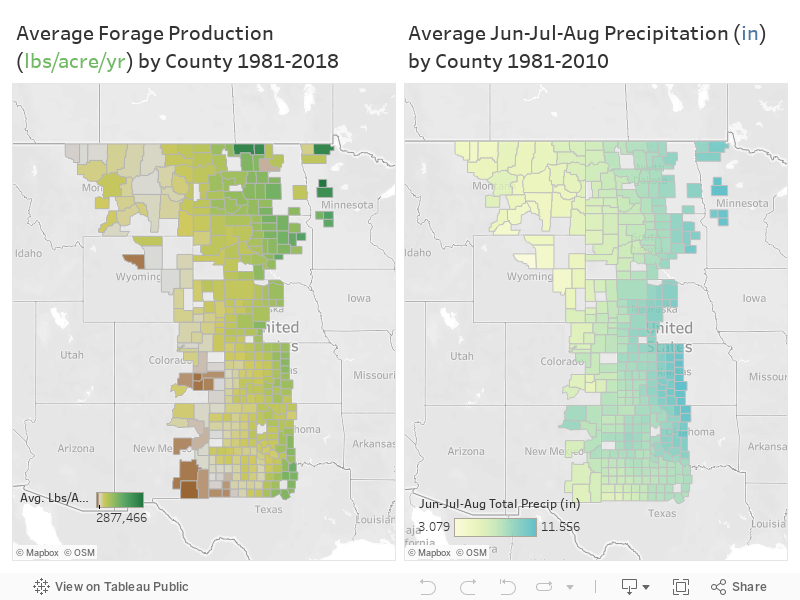
Most recent (June 11th) U.S. Drought Monitor showing areas in Abnormally Dry (yellow) or Drought (orange). Counties in blue have 50K head of cattle or great, while counties in green produce 40K tons of hay or greater.
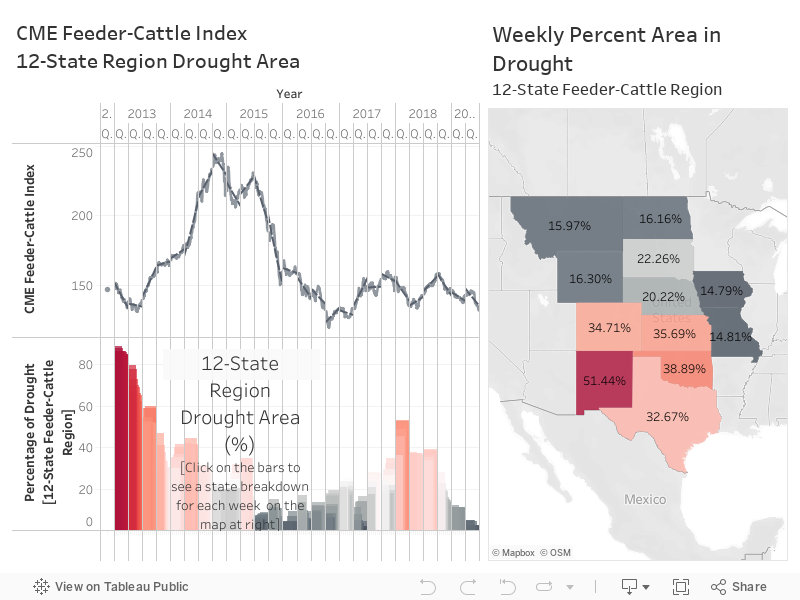
Interactive chart showing cattle, hay, and corn areas in drought since 2011. Mouse over the chart to see individual years.
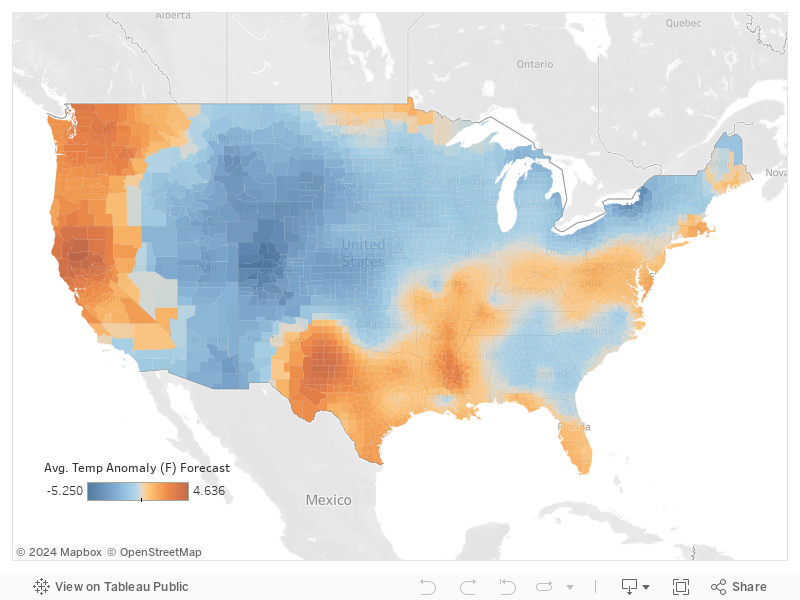
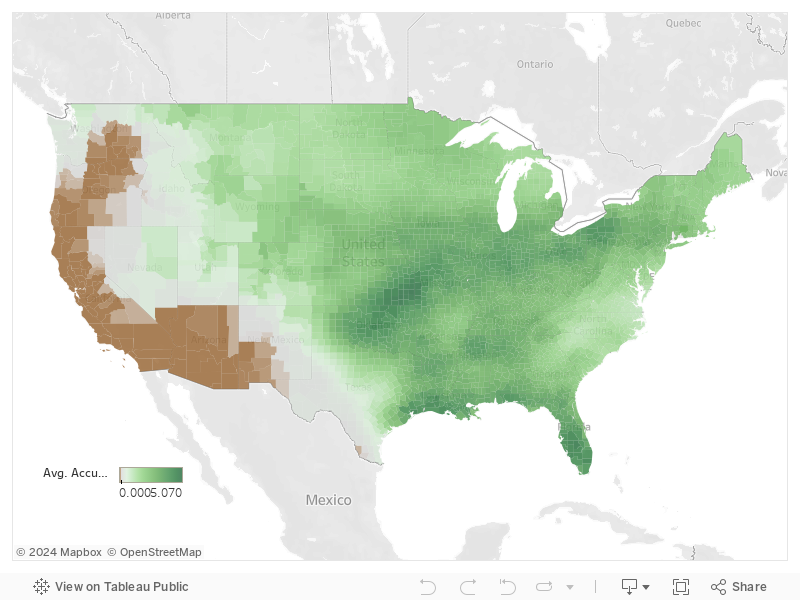
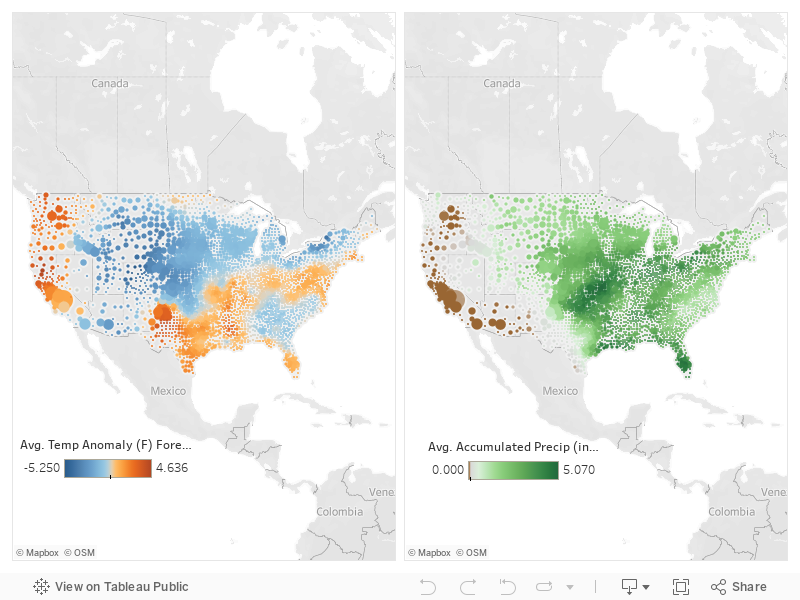
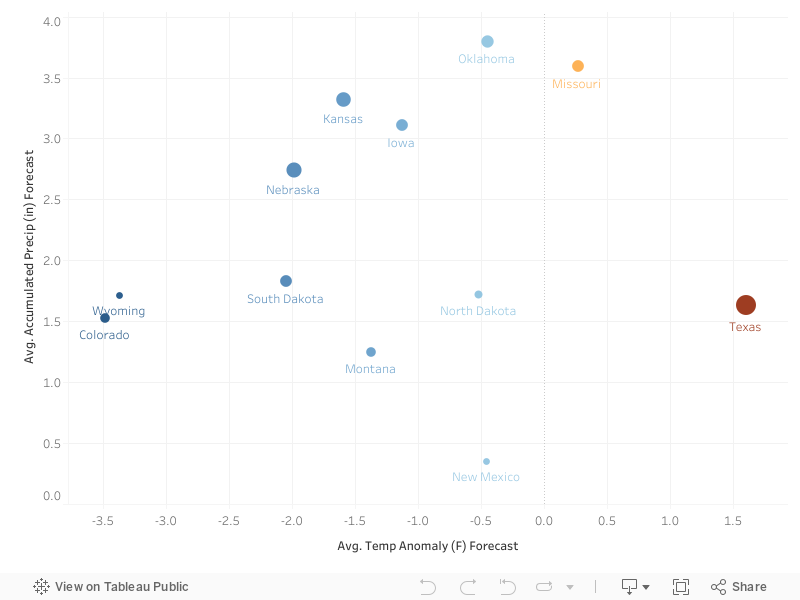
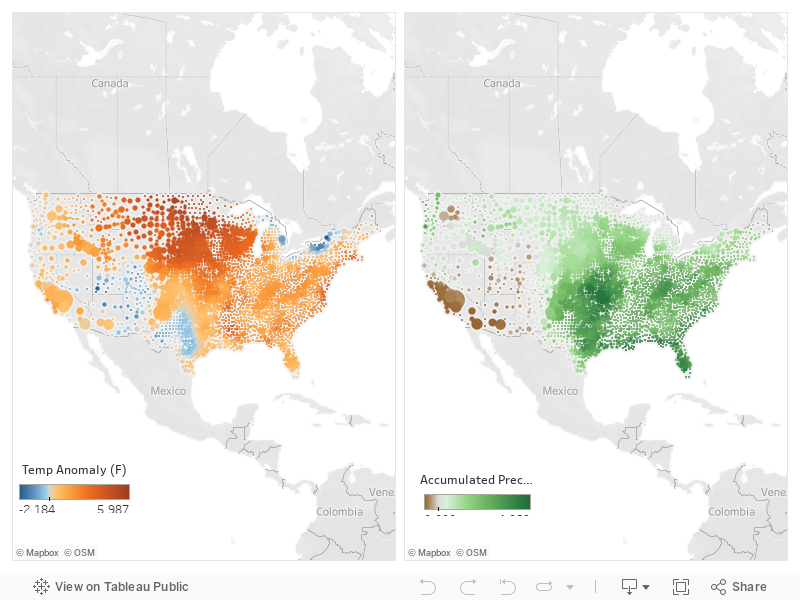
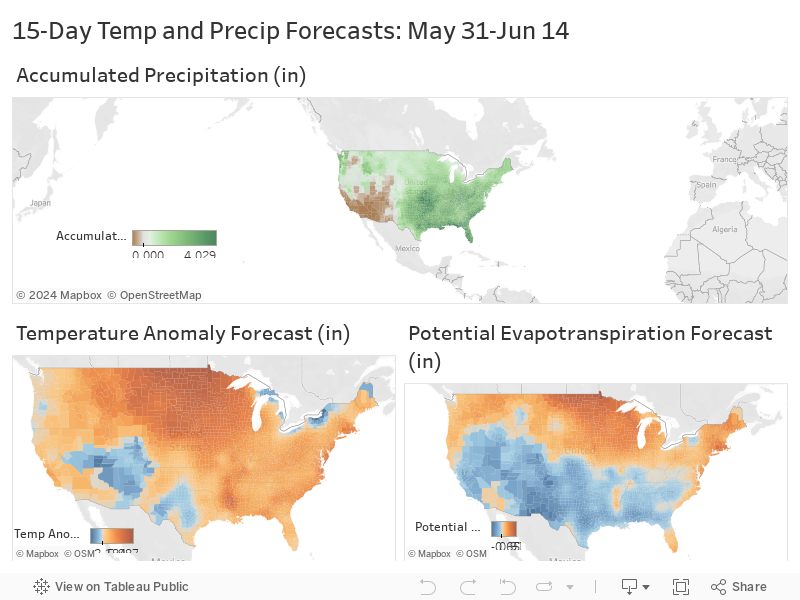
Potential Areas of Drought Improvement and Deterioration
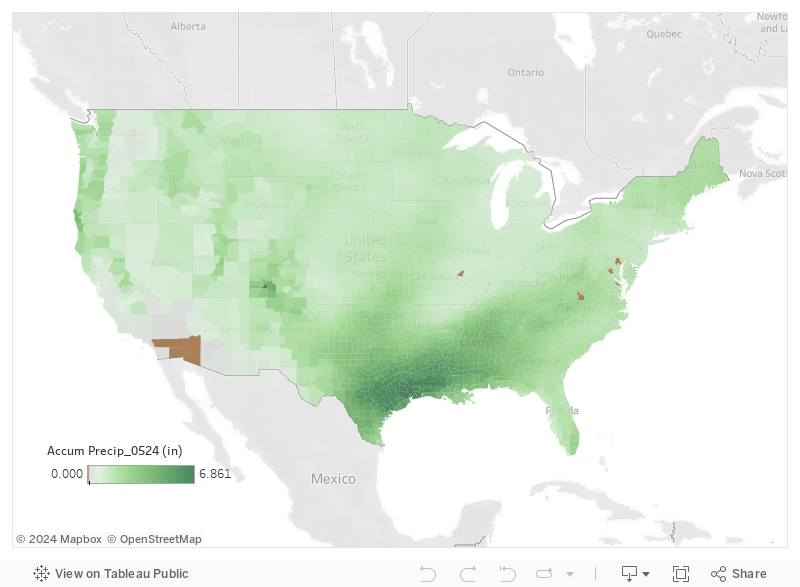
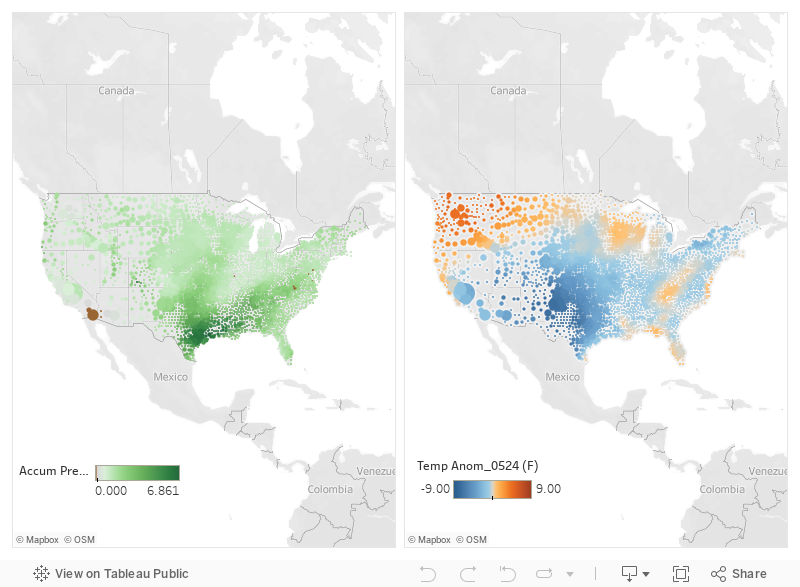
The 7-Day Accumulated Precipitation Forecast is calling for moderate-to-heavy rainfall totals from 2-to-4 inches across eastern portions of the Southern Plains, lower Midwest, and coastal areas extending from Georgia to North Carolina. Lesser accumulations (<2 inches) are forecasted for portions of the upper Midwest, Northeast, southern Florida, and the northern Rockies of Montana and Wyoming. Elsewhere in the West, dry conditions are expected.
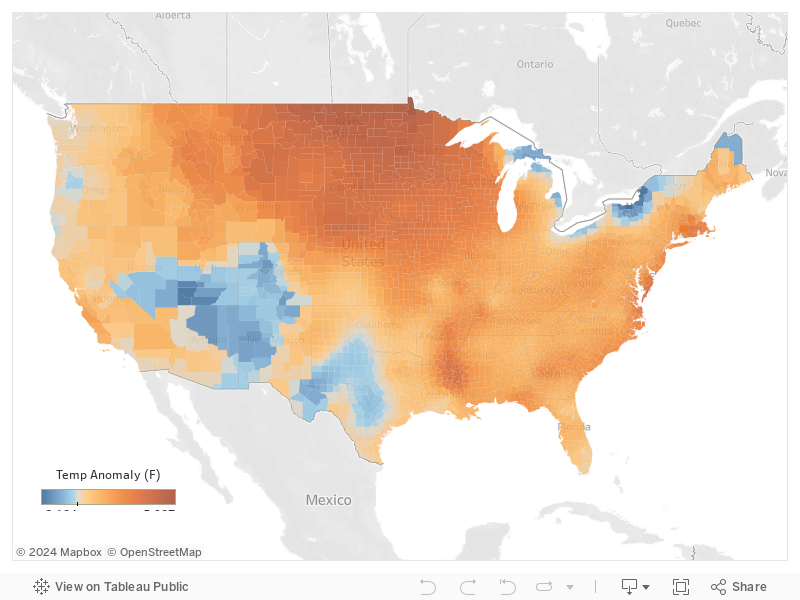
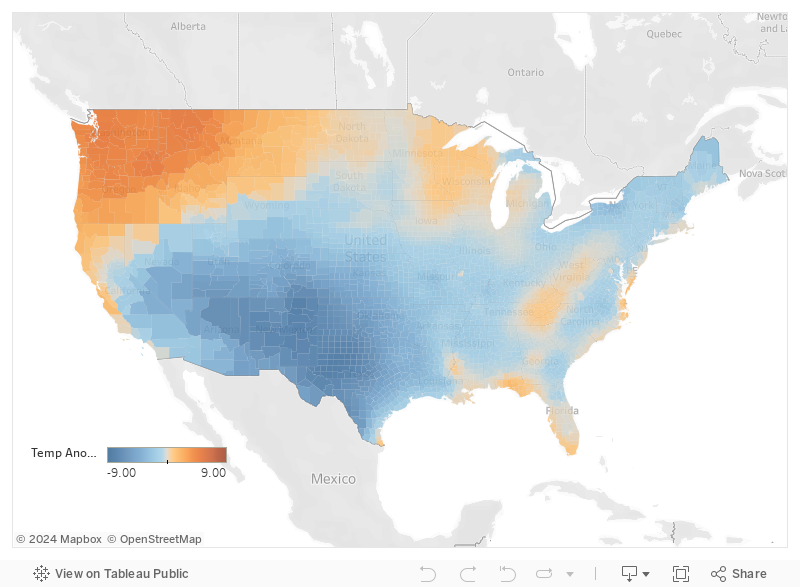
The map at right shows drought trends in the U.S. Drought Monitor over the last month. Areas in yellow/brown indicate areas where drought has intensified, while areas in green indicate where drought has improved. The Southeast, South Texas, and the Northern Plains (MT and ND) are places where drought has intensified over the last month.
With the upcoming moisture in the Southeast we expect conditions there to improve. With the expected high-temperatures in South Texas we expect some intensification of drought there and potentially along the U.S.-Mexico border. We expect drought to remain somewhat unchanged over the next couple of weeks in Montana and North Dakota. While they are expected to see some precipitation it likely will not be enough to change their current moisture deficits.

Most recent (June 11th) U.S. Drought Monitor Change Map from May 14-June 11th, 2019. Green colors show were drought conditions have improved over the last month while yellow/brown colors indicate areas where drought has intensified.