More Excessive Rain – Severe Storms – and Flooding

More Excessive Rain – Severe Storms – and Flooding

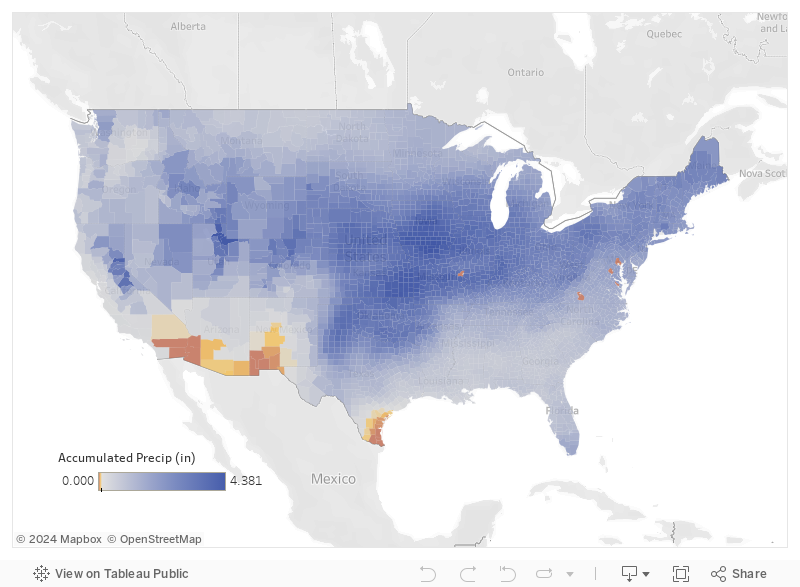
Rainfall over the Last 7-Days

Widespread rainfall of 8' or more has been observed over the last week.

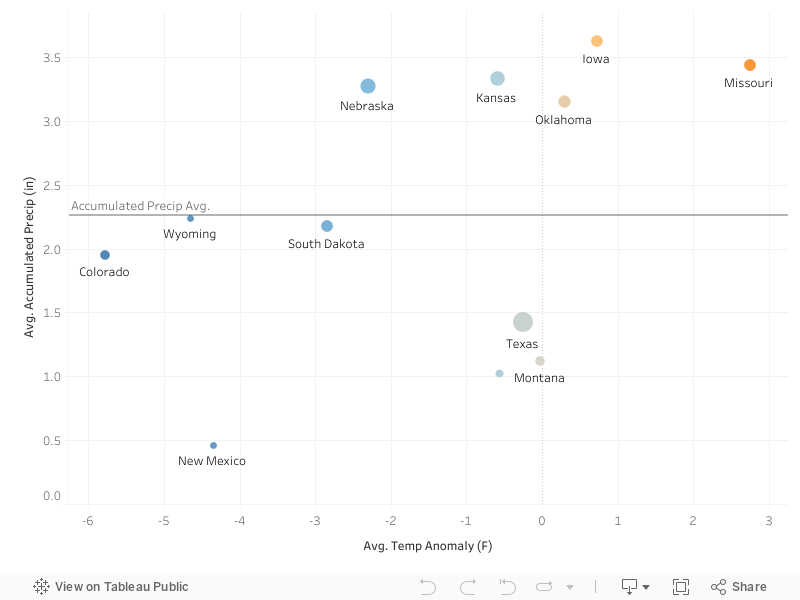
Additional Excessive Rain - Severe Storms - and Flooding

The central part of the nation will continue to experience extremely heavy rain, severe storms, and widespread flooding not only this week but next as well.

7-Day Accumulation Rainfall Forecast

The forecast over the next week is calling for up to 3" of rainfall over a large area of the Central U.S. adding to already very wet conditions and flooding in the region.

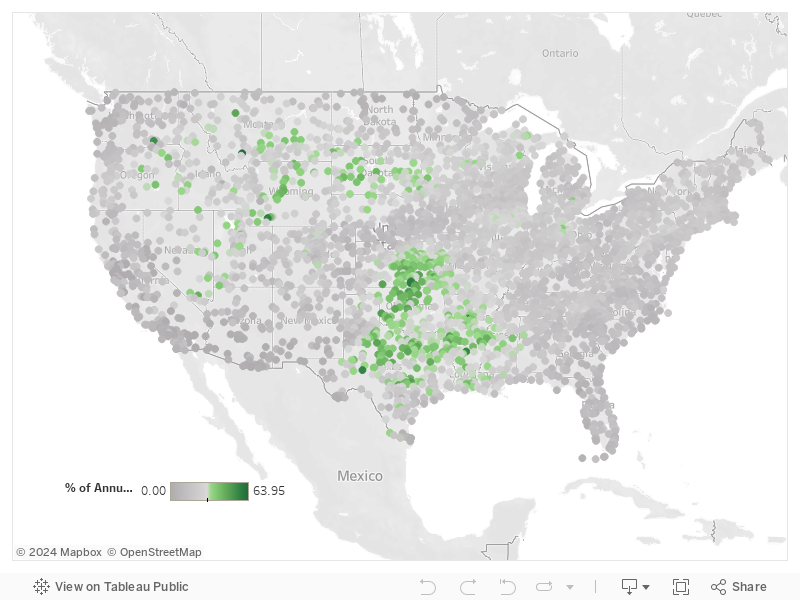
Risk of Heavy Precipitation

NOAA is calling for a moderate to weak risk of heavy precipitation over the Central U.S. between May 30th-June 5th. Slight risk has a likelihood of 20%-40% and Moderate risk has a likelihood of occurrence of 40%-60%.

Two-Week Forecasts

15-Day Temperature Anomaly Forecast: May 23-Jun 6

15-Day Accumulated Precipitation (in) Forecast: May 23-Jun 6

15-Day Temp-Precip Forecast for the 12 Major Feeder Cattle-Producing States

9 out of the 12 states will see state-wide temperatures below normal over the next couple of weeks.  WY, SD, NE, KS, OK, IA, and MO will see a average statewide accumulated precipitation above 2.0″.  NM will see very little precipitation but below-normal temps.

Timing is Everything and The Death of Average in 2019

Timing is Everything and The Death of Average in 2019

Have you been noticing quite a bit of precipitation lately? You’re not alone if you’re feeling rather water-logged this spring. Check out the latest U.S. Drought Monitor map (left map below) and you’ll see record low drought across the Contiguous United States.

Need a river perspective?  Check out the USGS Streamgage Network (right map below) and you’ll see rivers across the middle of the country busting at the seams.

Precipitation in Amarillo

Weather people will generally say conditions are “wetter than average,” but what does that even mean? Wetter than average can mean extremely different things for different locations. It can also mean very different things at different times of year.  Consider, for example, the seasonal cycle of precipitation at Amarillo, TX. In February, the driest month of the year, average precipitation is usually just over half an inch (0.5”). With just a quarter inch deficit for the month, they’d be at 50% of average, which sounds dreadful, but isn’t too bad and it certainly can be made up during the “wet” time of the year.  Consider another scenario: what if Amarillo got an extra 1” of precipitation in February?  Suddenly, they’d have 279% of average precipitation. But in terms of total contribution to the water they get, pretty small: it’s still only 8% of their annual average. Big things just don’t tend to happen in a dry month.

Now consider a wet month in Amarillo – June. They normally get over 3” of precipitation, or about 16% of their annual average of 20.36”. Now a 50% of average June would mean a 1.5” deficit, which is not as easy to make up. Get 200% of average in June, and you’re at a 3” surplus and 31% of your annual total. You could have a really dry February, and easily make up the deficit with just a tiny bit above average in June. As they say: timing is everything.

The Death of Average in 2019

So, what’s been going on this spring? Check out the below map that shows locations that either expect to be “wet” or “dry”, climatologically speaking, in April. Most of the middle of the country doesn’t really lean either way. Track along the Mississippi valley from St. Louis down toward Louisiana and we see April is normally a wet time of year. That area of Ark-La-Miss (southern Arkansas, northern Louisiana, and Mississippi) just happened to get hit with much above average precipitation in April.

Now check out the locations in May that expect to be “wet” and “dry” in May. Much of the country, including the majority of the Great Plains, start seeing their wet season in May. Areas of east Texas and up into Oklahoma and Kansas have been pummeled with frequent storms in the past few days. Add to that the Northern Plains getting hit with heavy storms in March and the middle of the country is having a hard time drying out.

This final map shows the % of the annual precipitation that has fallen from April 1 – May 21 this year across the U.S.  Use your mouse to see percentages for specific locations.

Concentrate on the areas with light and dark green dots: In the past 50 days, these locations have received 30-60% of the total amount of precipitation they usually receive for the whole year! The wide swath extends from central Texas north into Oklahoma and Kansas, and east into Louisiana and Arkansas. For these areas, we’re talking a water surplus of 8-12”!

The Takeaway

The takeaway message is that it’s going to take some time for things to return to normal and for the soils to dry out a bit. Temperatures have unfortunately not been a help. With mostly widespread cooler than average temperatures over the past 60 days, evaporative losses have been less than average, further inhibiting the “drying out” of these locations. Additionally, June and July continue the climatological wet season. So, for now, the trend looks to continue into the near future.

Share on facebook
Share on google
Share on twitter
Share on linkedin
Share on pinterest