Livestock Wx
What do We Talk About When We Talk About Drought? Is it Data, Impacts, or Both?
- Becky Bolinger
- July 24, 2020
- 1:54 pm
Years from now, when we look back on 2020, drought is probably not going to be the first topic that comes to mind.
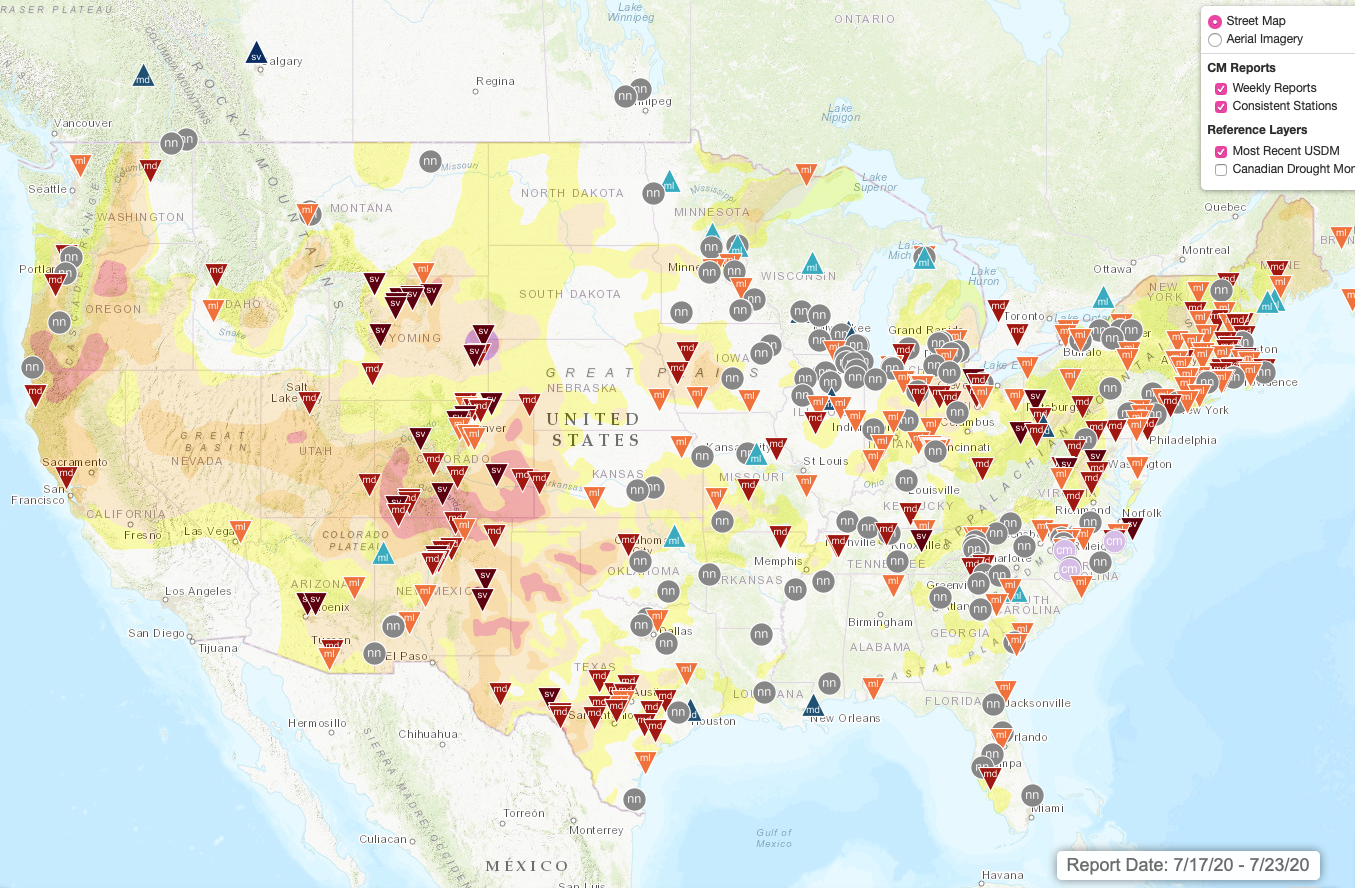
Nonetheless, in the midst of all that has been happening, drought has plagued many Americans this year. According to the latest U.S. Drought Monitor, 27% of the lower 48 is experiencing drought.
Most of this is from the 100th Meridian westward. The extreme drought category – D3 – is reserved for conditions that have a probability of occurring once every 20 to 50 years. D3 has become widespread across southern Colorado with pockets of D3 also showing up in Kansas, Oklahoma, Texas, New Mexico, Wyoming, Utah, and in Northern California and Oregon.
What Data Indicates it’s an Extreme or D3 drought?
Each week, climatologists are looking at current data and how it compares to the long-term average.
One of the first variables we consider is precipitation. In terms of drought, one good way to evaluate precipitation is called the Standardized Precipitation Index.
This index tries to fit a location’s precipitation onto a “bell curve” distribution, where values around 0 are normal. The more negative the value, the more severe and infrequent the dry anomaly is. Here’s a look at SPI values across the country since January 1, 2020.
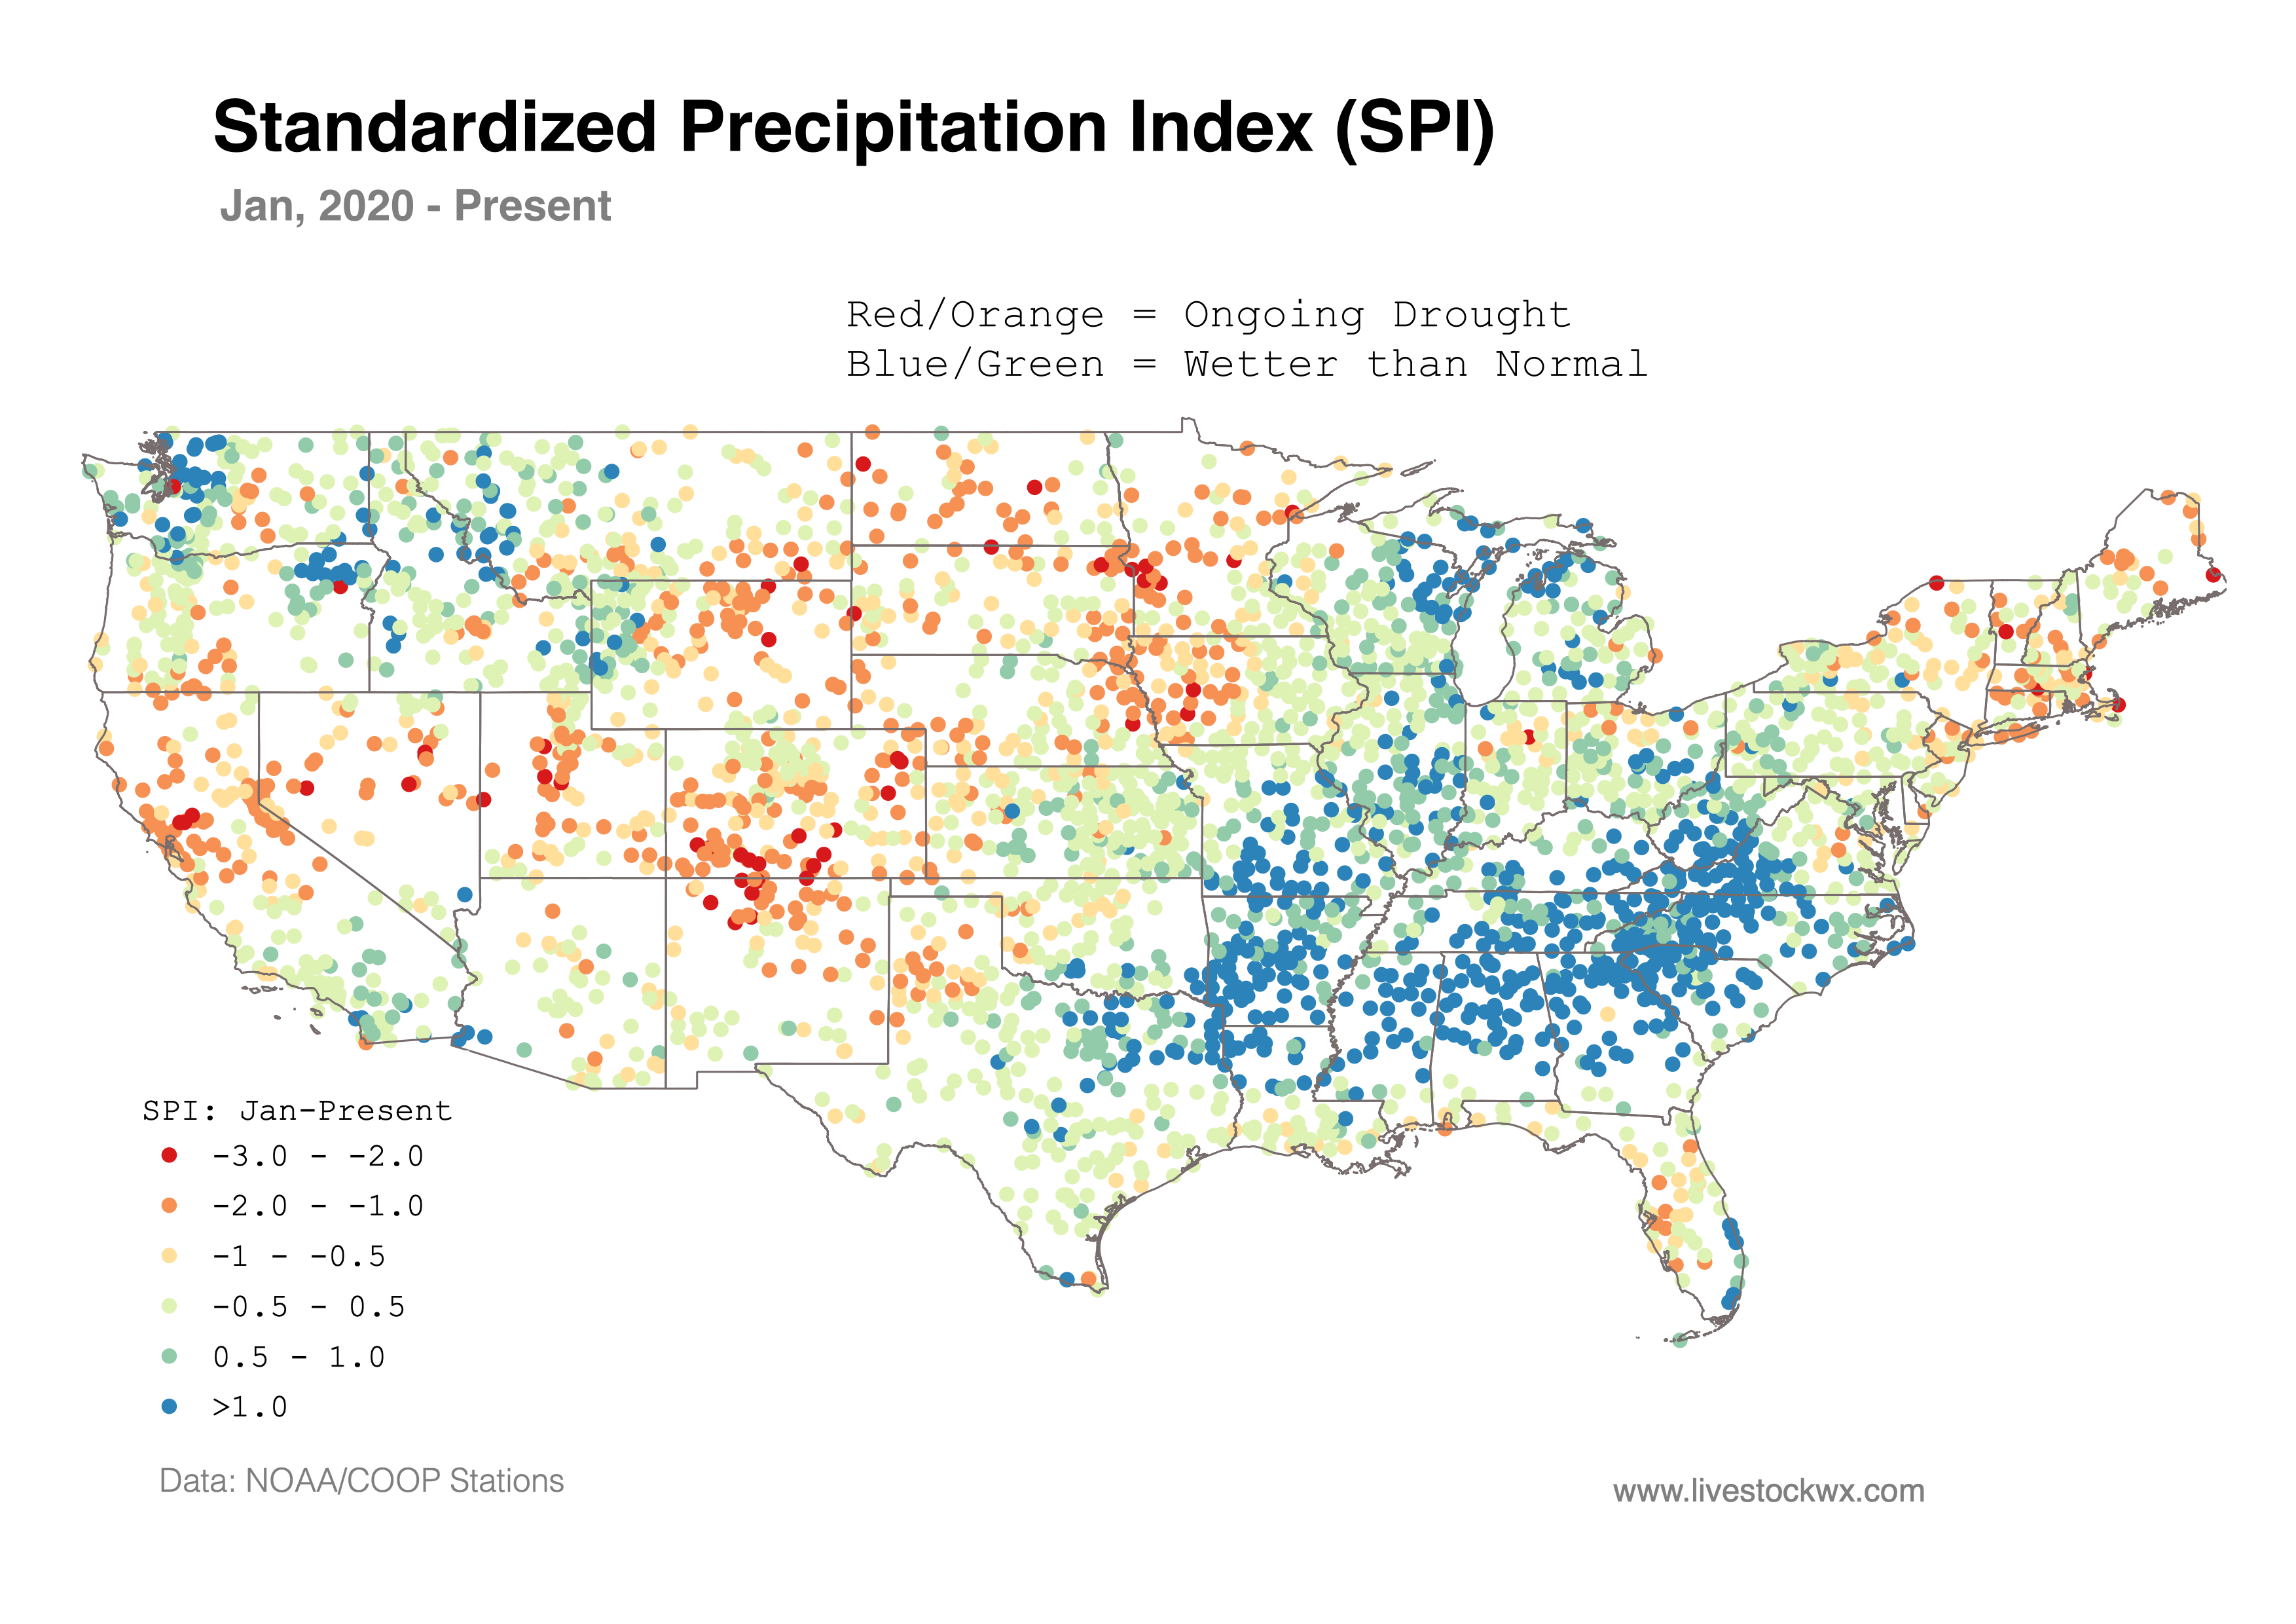
SPIs less than -1 can be found throughout the Northern Plains, extending south into the Texas panhandle. Starting with Wyoming and Colorado, negative SPIs can be seen heading west through Utah, Nevada, and California.
With precipitation deficits through spring and into summer, drier soils and hot temperatures followed for much of this area.
Streamflows have also dropped in the region as a result of lower snowpack in the mountains and lack of springtime precipitation in the lower elevations.
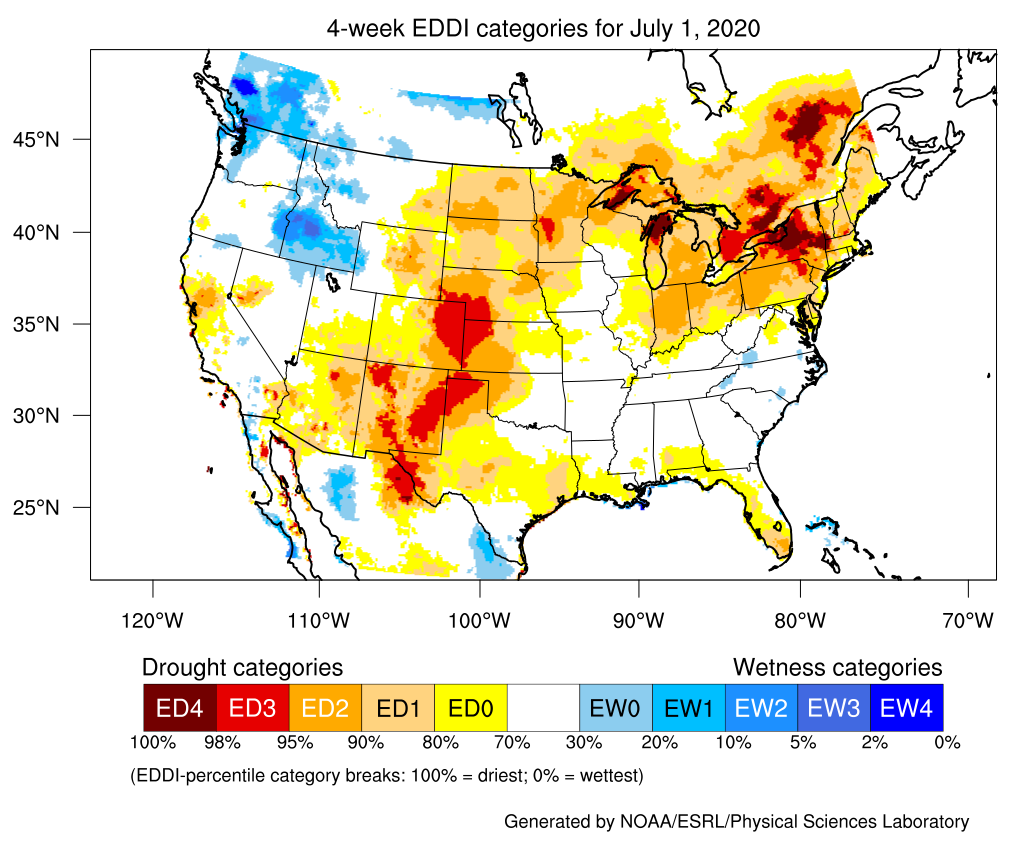
Higher evaporative demand (map below) has also plagued the region. The Evaporative Demand Drought Index (EDDI), is a way to measure how much water the atmosphere wants to take from the surface. This map of EDDI shows how anomalously high the evaporative demand was for the month of June.
In short, all of the indicators that we look at – precipitation, temperature, soil moisture, streamflow, evaporative demand, etc. – have led to a depiction of widespread drought throughout the central and western U.S., including the introduction of D3, or Extreme Drought.
"Like the tree falling in the forest, does drought occur if there is no human to record or experience it?" —Kelly Redmond, Climatologist Extraordinaire
It’s becoming increasingly important for scientists to consider the impact an event may have on humans, animals, and the ecosystem.
This takes us a step beyond just looking at the data. Think of the family that lives near a coastline that gets wiped out by a hurricane.
Doesn’t matter if the data indicated whether it was a Category 2 or Category 3 hurricane if their home is now destroyed.
Think of the commercial truck driver who’s struggling to make it through white-out conditions and strong blowing winds. Doesn’t matter to that driver if it’s not an “official” blizzard. It’s about the impacts.
Sometimes, this is harder to do with drought, because there’s not a very clear-cut beginning and ending to the event. The boundaries are never really clear. But it’s important for climatologists to adequately assess the impacts side of all extreme events, including droughts.
As of July 14, the USDA has estimated that 17% of the nation’s hay acreage, 27% of winter wheat production, and 25% of the country’s cattle inventory are experiencing drought.
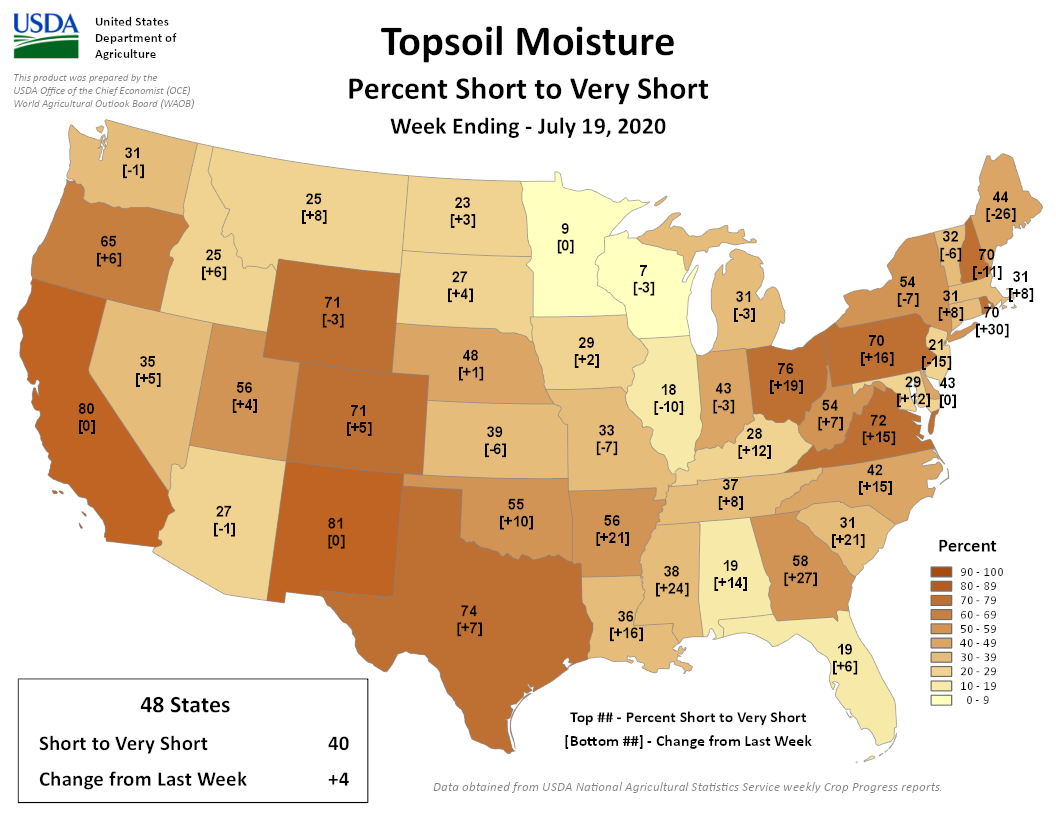
The weekly crop progress report from the National Agricultural Statistics Service shows significant areas of states with short-to-very short topsoil moisture (left map below). 81% of New Mexico’s topsoil moisture is rated short to very short, and 80% for California.
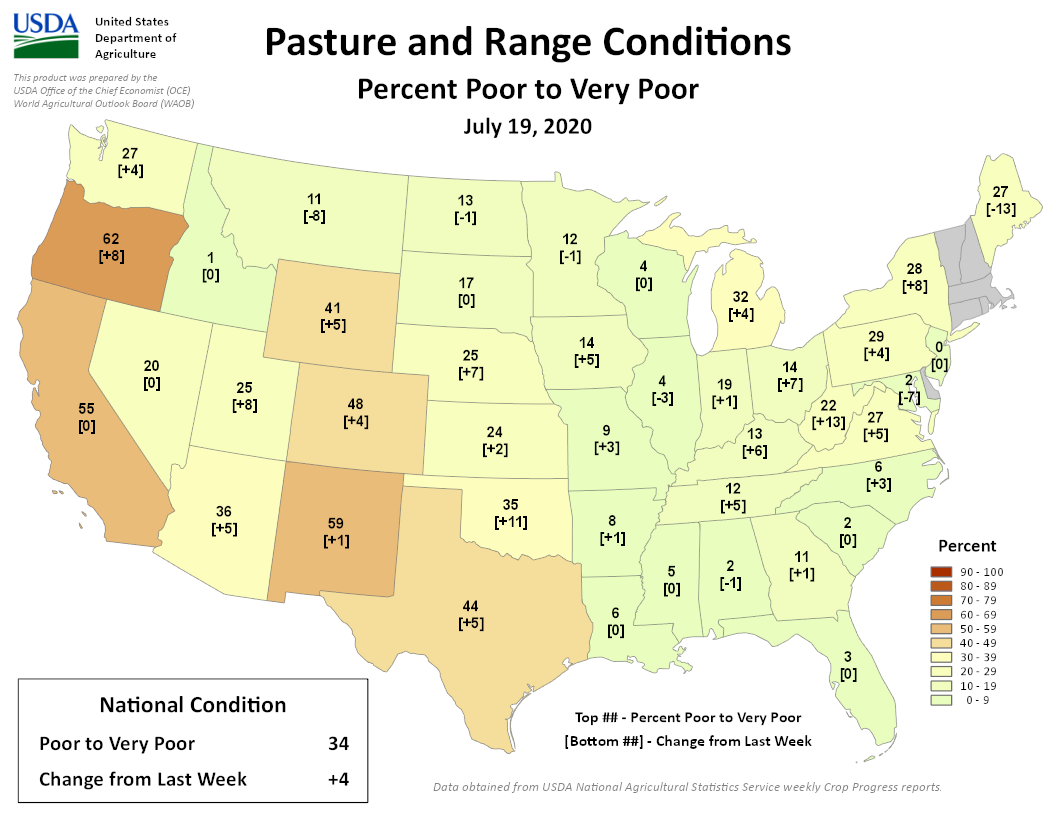
The percent of pasture and range conditions that’s poor or very poor (right map below) is almost half for Colorado, 41% for Wyoming, and 62% for Oregon.
In fact, when pasture and range conditions are blended together into one index for the U.S., in the last 10 years, there’s only one year that the conditions have been worse – 2012. If you remember how bad 2012 was, you’ll know that is a big deal.
Harvesting Impact Information
These poor conditions are having a significant impact on farmers and ranchers. Here are several of the ways climatologists are finding information on impacts:
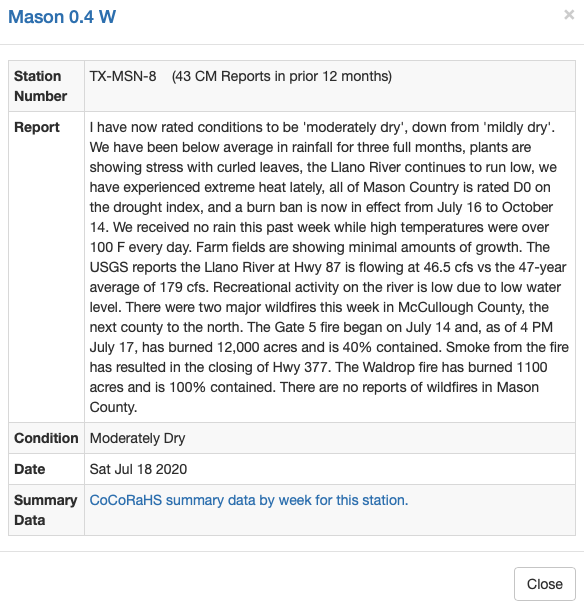
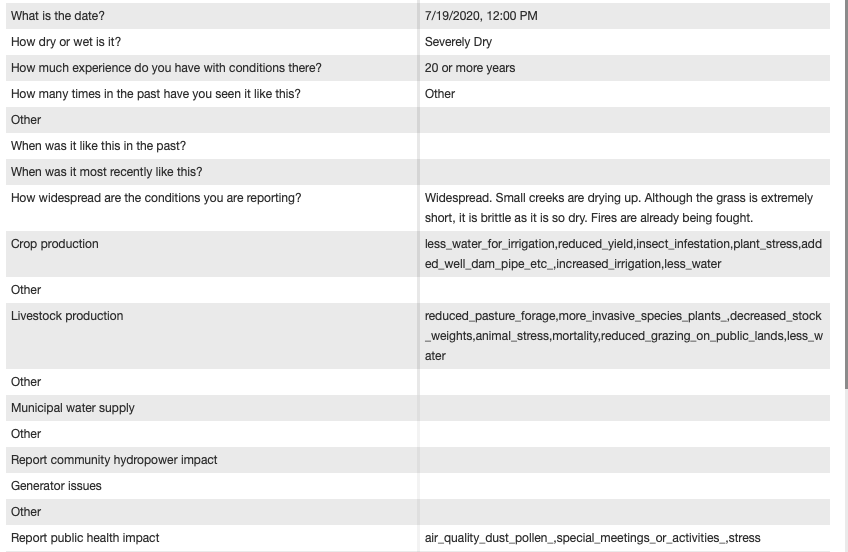
- CoCoRaHS Condition Monitoring. CoCoRaHS (or the Community Collaborative Rain, Hail, and Snow Network) is a way for anybody to measure precipitation at their own location. CoCoRaHS volunteers can now also report on-the-ground conditions. In the last week alone, hundreds of Condition Monitoring reports have come in, including this detailed one near Mason, Texas. If you’re a CoCoRaHS observer, submit your local report today. If not, it’s easy to become a CoCoRaHS volunteer observer.
- The National Drought Mitigation Center in Lincoln, Nebraska has recently ramped up efforts to gather more impacts information from the field. You can submit your conditions here.
- Through local Extension and FSA offices. Many state climate offices are in frequent contact with these county directors in their states to get a pulse on what producers in the area are currently experiencing related to climate and weather. The Colorado Climate Center, for example, has been communicating regularly with Extension and FSA during this drought. FSA County Executive Directors will send us information such as producers applying for emergency grazing, submitting Notice of Losses, or if irrigators are running out of water.
Maybe you’re wondering why you should be sharing this information with the climate and drought community.
Perhaps it doesn’t seem to make a difference? Well, the more information we gather about impacts during specific drought events, the more we can point to these risks and vulnerabilities for future events.
Perhaps this improved flow of information can provide more support for the idea that emergency response to (and assistance for) droughts should be impacts-based instead of based on the probability of occurrence of data metrics.
Becky Bolinger
Dr. Bolinger is the Colorado Assistant State Climatologist. She is based at Colorado State University and is a frequent contributor to Livestock Wx, the U.S. Drought Monitor and tracks all things climate around Colorado.
All Posts