Livestock Wx
Drought Trends for April 23, 2019: Record Drought-Nada Continues
[Excerpt from the April 23rd U.S. Drought Monitor]
Severe weather and substantial rainfall were observed in parts of the Southern Plains, lower Mississippi Valley, Southeast, and mid-Atlantic during April 17-19. Moderate to heavy precipitation (1.5-4 inches) also occurred over the western Great Lakes region, Tennessee and central Ohio Valleys, parts of New England, and northwestern Washington. Light to moderate precipitation (0.5-2 inches) was widespread in the Northwest, eastern Great Basin, northern and southern thirds of the Rockies, northern Plains, and the eastern third of the Nation. Only portions of the Southwest, central Rockies and Plains, and western Corn Belt saw little or no precipitation. Weekly temperatures averaged above-normal for much of the contiguous U.S.
With near- to record wetness in many parts of the country this winter and in 2018, the April 16 USDM had the lowest percent of area in drought (D1-D4) for the lower 48 States (3.73%) and all 50 States (3.78%) since the inception of the U.S. Drought Monitor in 2000, surpassing the previous low drought standard of May 23, 2017. In fact, no dryness/drought (D0-D4) in both the lower 48 (85.88%) and all 50 States (87.06%) also set record low values last week. With more wet weather over D0-D2 areas this week, new USDM record lows will most-likely be set.
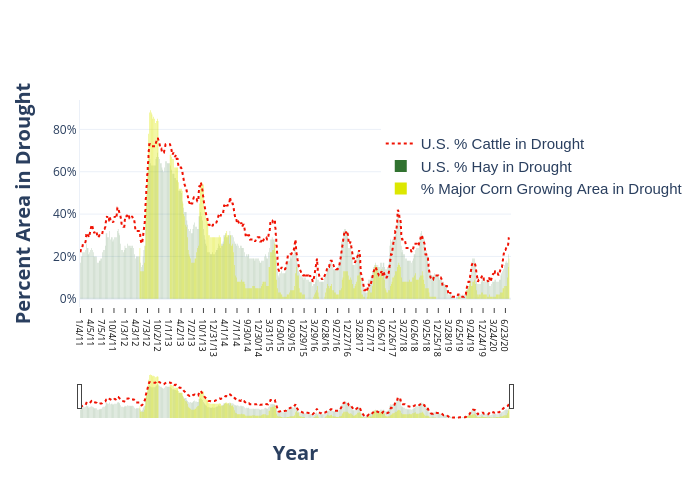
The percentage of cattle, corn, and hay in drought continues to remain low at 1% cattle, 1% hay, and no corn areas considered in drought.
1% Cattle in Drought

1% Hay in Drought

Most recent (April 23rd) U.S. Drought Monitor showing areas in Abnormally Dry (yellow) or Drought (orange). Counties in purple have 50K head of cattle or great, while counties in green produce 40K tons of hay or greater.
Interactive chart showing cattle, hay, and corn areas in drought since 2011. The data are ranked from highest to lowest in drought. Mouse over the chart to see individual years.
Potential Areas of Drought Improvement and Deterioration
The below images show the current U.S. Drought Monitor and the 15-Accumulated Precipitation and 15-Day Potential Evapotranspiration Forecasts. Potential Evaportranspiration, or PET, is the amount of evaporation that would occur if sufficient water is available. Basically, you can think about it as the amount of water that could be evaporated from the soils and plants (if water was not limited, which is why it has “Potential” in the title).
Much of the Contiguous U.S. will see precipitation of an 1″ or greater over the next 15 days. Evaporation rates will be highest over parts of Texas, the Southwest and the Southeast. With the exception of New Mexico and possibly the Southeast, most areas currently considered Abnormally Dry or in Drought will see some decent precipitation over the next couple of weeks. At least into early May, we do not see much potential for the record low drought percentage to reverse course. New Mexico and Georgia/South Carolina could see some expansion and may be the only exceptions at this point.
April 23, 2019 U.S. Drought Monitor. Counties shaded in purple have cattle densities of 50K head or more.
15-Day Forecasts for precipitation (in.) and potential evapotranspiration (in.) The forecasts cover the period from April 26-May 10, 2019.
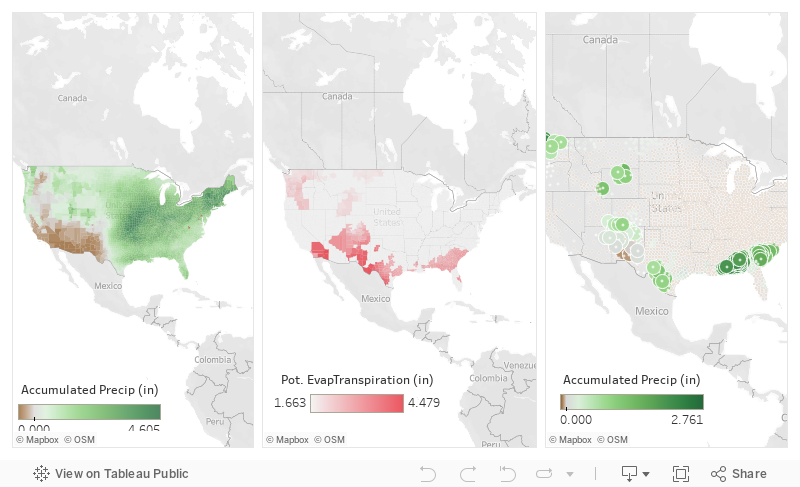
15-Day accumulated precipitation forecast (green/brown) compared to the 15-Day Potential Evapotranspiration Forecast (red/gray) for the period of Apr 26 – May 10. The third map shows areas in drought (bubble size) and the expected precipitation over the next 15 days. Many areas currently considered Abnormally Dry or in drought are expected to see some precipitation over the next couple of weeks. Use your mouse to see data for individual counties.
Share on facebook
Share on google
Share on twitter
Share on linkedin
Share on pinterest
