Weather Impacts on Feedyard Performance

Weather Impacts on Feedyard Performance

The Daily Livestock Report for April 5th included data on Kansas feedlot performance.  The data are based on Kansas State University’s Focus on Feedlots February report that shows the impacts of severe winter weather on Kansas feedlot performance. 

The Focus on Feedlots February report showed average daily gain (ADG) of steers sold in February was 3.43 pounds, which is down 0.5 pounds or -1.4% from 2018.  Looking at the 5-year average, ADG was down by 4.1%. 

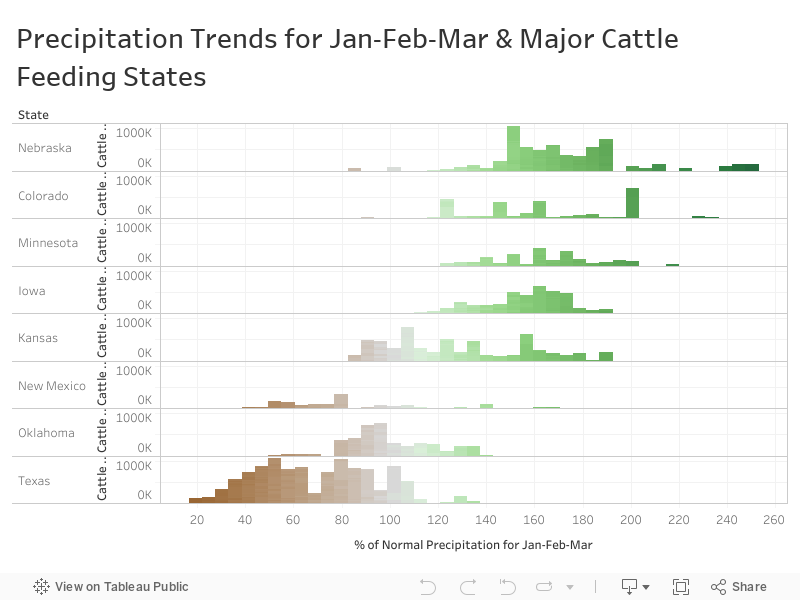
According to the report, more pounds of feedstuff were needed per pound of gain.  The figure below shows major cattle feeding states and the percent of average precipitation for January-February-March.  This doesn’t tell the whole story, but it does show significant cattle numbers in Nebraska, Colorado, Iowa, and Kansas experienced very wet and muddy conditions this winter.  The cost of gain increased (based on feedlots participating in the Kansas survey) for steers closed-out in February by 5.7% ($4.53/cwt) compared to February 2018.

Interactive Chart: Mouse over the chart to see county level data

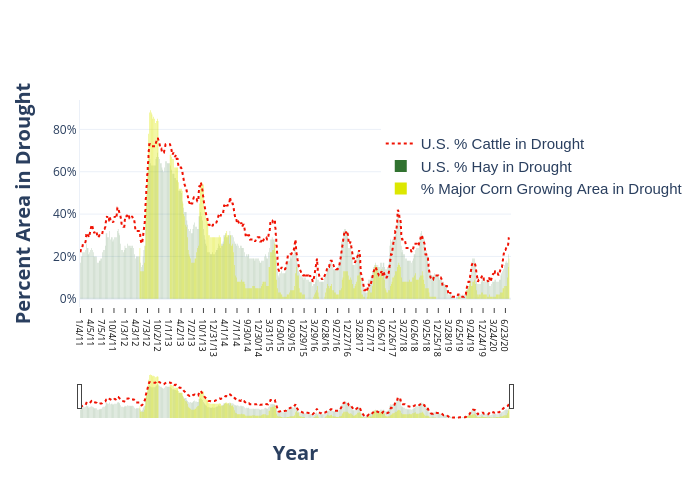
This trend is consistent with what we’re seeing across the country.  According to the Daily Livestock Report and data released by USDA “the Federally Inspected U.S. steer carcass weight was 866 pounds, down 12 pounds from a year earlier and 2 pounds below the prior 5-year average (2013-17).” 

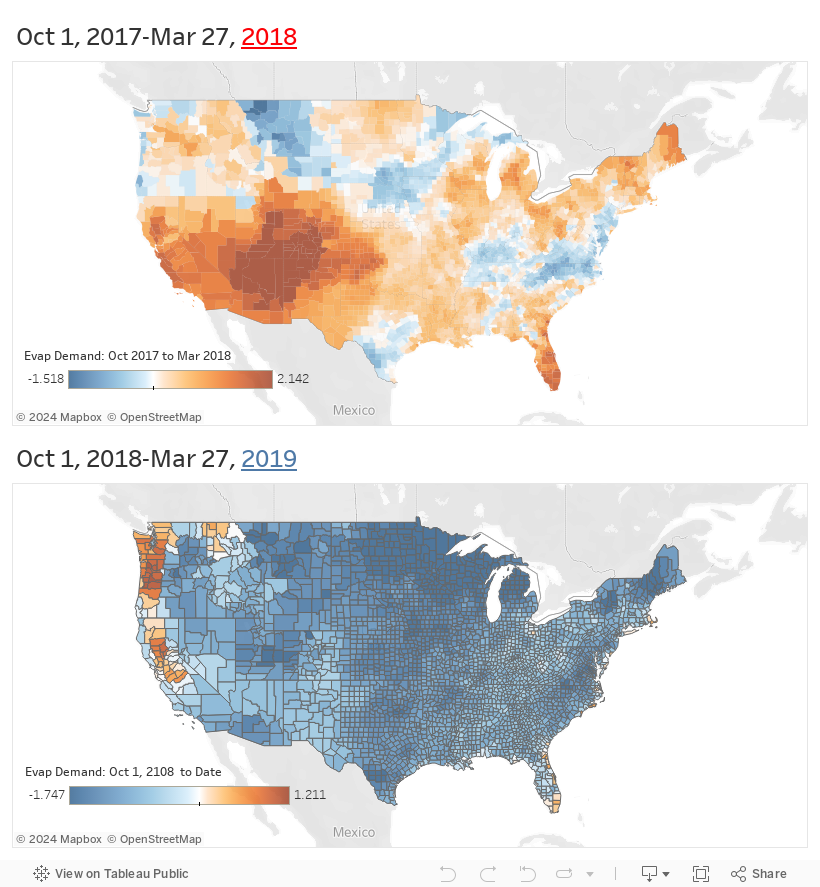
With a wet spring predicted, we could continue to see lower weights as pen conditions continue to stay muddy.  Over the next week we will see an active weather pattern with Nebraska and Iowa seeing fairly good precipitation (see map below).  We will continue to track conditions as they evolve over the next several weeks.

Share on facebook
Share on google
Share on twitter
Share on linkedin
Share on pinterest

By the Numbers for the Week of April 8, 2019

By the Numbers

By the Numbers for the Week of April 8, 2019

  • 7-days of precipitation

    Over the next week, a large part of the Contiguous U.S. will see abundant precipitation. For Texas and Oklahoma, East Texas and up into Southeast Oklahoma could see 2” or more of moisture. Maybe next week we will report on another drought record being broken, since much of the rainfall will be hitting areas where drought was recently expanded.

  • 2nd out of 34 years

    Speaking of drought, those Coloradans are pushing hard for its departure from the state. Now that we are out of winter and peaked snowpack has been reached, the Colorado snowpack was the second highest in the last 34 years. I’m sure the ski industry couldn’t be happier. (USDA’s Natural Resources Conservation Service)

Share on facebook
Share on google
Share on twitter
Share on linkedin
Share on pinterest

Drought Trends for April 2, 2019

Drought Trends for April 2, 2019

The low percentage of drought across the contiguous U.S. continues this week.  The percentage in drought is approximately 6% up about a percentage point from last week.  The largest change was in the Southeast, specifically Alabama, Florida, and the Carolina, where precipitation deficits have been growing.  These areas could see some improvement as storms will be moving in over the next week. 

Central Texas up into the Rolling Plains also saw an expansion of areas considered Abnormally Dry (D0).  This category is not considered “drought” but it is the first warning sign.  We don’t see too much to be worried about at this point.  This area could see anywhere from a quarter inch to over an inch of rainfall over the next week.

The percentage of cattle and hay in drought ticked up slightly by one percentage point from last week.  No major corn growing area is in drought.  We don’t see these trends changing anytime soon.

Cattle in Drought
0 %
Hay in Drought
0 %
Interactive chart showing cattle, hay, and corn areas in drought since 2011. Use the slider at the bottom of the chart to zoom to a particular set of years.
Plot 40
Share on facebook
Share on google
Share on twitter
Share on linkedin
Share on pinterest

Evaporative Demand Extremely Low This Year: Grass Production and Grazing Should Benefit​

Evaporative Demand Extremely Low This Year: Grass Production and Grazing Should Benefit

Evaporative demand is basically the pressure the atmosphere puts on plants and soil to draw water through evaporation.  Evaporative demand can tell us much about drying power we’re seeing over almost any time period we’re interested in tracking.  Often, we look at the Water Year, which runs from October 1 to September 30th.  Usually the fall and winter are periods when you have very little plant growth and consequently very little water usage, which helps recharge the soil for the growing season starting in the spring.

This year, we have seen very little evaporative demand.  Some places, for example, like the Central to Northern Plains, that have experienced extreme flooding are seeing evaporative demand conditions that are way outside the norm. In some cases, they are seeing values that occur only about 5% to 2% of the time going back to 1978.

What this means is that soil moisture has reached its capacity and we will continue to see high runoff efficiencies into streams and rivers, which could make flooding worse.  In other places that have not experienced flooding, good soil moisture will likely mean good grass production and a good grazing year for livestock.

The below interactive chart shows the Evaporative Demand Drought Index, that was developed by researchers at NOAA.  You can move your mouse over each county to see what the 2019 Water Year looks like for your area.

Evaporative demand for the period between October 1st. to March 27th for 2018 and 2019.  The color scale and the frequency these conditions have been observed since 1978 is below.

Exceptionally Wet (-2.5 - -2.0, occurs less than 2%)
2%
Extreme Wet (-2.0 - -1.5, occurs 5% to 2% of the time)
5%
Severe Wet (-1.5 - -1.2, occurs 10% to 5% of the time)
10%
Moderate Wet (-1.2 - -0.7, occurs 20% to 10% of the time)
20%
Abnormally Wet (-0.7 - -0.5, occurs 30% to 20% of the time
30%
Exceptional Drought (2.0 – 2.5, occurs less than 2%).
2%
Extreme Drought (1.5 – 2.0, occurs 5% to 2% of the time)
5%
Severe Drought (1.2 – 1.5, occurs 10% to 5% of the time)
10%
Moderate Drought (0.7–1.2, occurs 20% to 10% of the time)
20%
Abnormally Dry (0.5 – 0.7, occurs 30% to 20% of the time)
30%
Share on facebook
Share on google
Share on twitter
Share on linkedin
Share on pinterest

By the Numbers for the week of April 1, 2019

By the Numbers

By the Numbers for the week of April 1, 2019

Share on facebook
Share on google
Share on twitter
Share on linkedin
Share on pinterest

Drought Trends for March 28, 2019

Drought Trends for March 28, 2019

South Texas saw an increase in dryness and drought over the last week, meanwhile the overall drought trend for the U.S. has improved.

Most of the Central and the Northern Plains continue to be drought free, with extreme flooding being the largest concern.

For those interested in U.S. Drought Monitor stats, this week is lowest percentage of Severe Drought (D2) for the Contiguous U.S. since the Drought Monitor started in 2000.

Cattle in Drought
0 %
Hay in Drought
0 %

Data courtesy of the National Drought Mitigation Center (NDMC), the U.S. Department of Agriculture (USDA) and the National Oceanic and Atmospheric Administration (NOAA).

The percentage of corn, cattle, and hay that are considered in drought continues to be extremely.  The percentages remained unchanged from last week with 2% of cattle, 2% of hay, and 0% of corn in drought.

Interactive chart showing cattle, hay, and corn areas in drought since 2011. The data are ranked from highest to lowest in drought. Mouse over the chart to see individual years.

Plot 40
Share on facebook
Share on google
Share on twitter
Share on linkedin
Share on pinterest

El Niño is Back and Gaining Speed What Does that Mean for our Spring Weather?

El Niño is Back and Gaining Speed What Does that Mean for our Spring Weather?

After going ‘AWOL’ in January, El Niño came back in mid-February, contributing to an active storm track that has brought much-needed moisture to much of the western US.  The wet conditions have reduced the area considered in drought considerably over the course of just one month.

Image courtesy of NOAA/Climate Program Office

We recently spoke to Klaus Wolter, who is a retired researcher at the University of Colorado that specializes on El Niño and La Niño events, about what the recent strengthening could mean for our weather going forward.  Wolter explained that “while most El Niño events tend to persist through winter and weaken into spring, they can get a late boost during the winter, with the most recent examples being the weak El Niño of 2014-15 that morphed into the Super Niño of 2015-16, and the weak El Niño of 2004-05 that had a late rally in early 2005, but then dissipated by mid-2005”. Wolter said that going forward, “the majority of the ECMWF [European Centre for Medium-Range Weather Forecasts] model runs show moderate El Niño conditions during early summer, followed by greater uncertainty in the fall”.  Wolter said even though there is uncertainty in the fall timeframe there are still increased odds of a 2nd El Niño winter given that the majority of climate models show El Niño conditions into early 2020. Wolter described that while two-year El Niño events are not quite as common as ‘double-dip’ La Niña events (i.e. two or more years La Niña), they have occurred six times since 1948: 2014-16, 1991-93, 1986-88, 76-78, 68-70, and 1957-59.  “As best as we can tell, the late spring season (April-June) during such conditions tend to be similar to typical El Niño springs, with much cooler-than-average temperatures most likely in the southern plains and much warmer-than-average temperatures in the northwestern US”, Wolter said.
The above maps show the risk of WARM or COLD extremes (upper/lower 20%; left map) during April-May-June of El Niño, compared to the average outcome during the first year spring of a two-year El Niño (right map).  Essentially what Wolter is saying that it does not make much difference for spring whether you consider all El Niño events or just the ones that persisted into the following year.

For precipitation, the general risk (left map above) of being in the wettest 20% of the observed springs during 1895-2014 is highest from southern California along the Mexican border and continuing to Louisiana during El Niño springs, while the risk of ending up in the driest 20% is highest over the northern plains and Midwest, which is consistent with what we would normally expect for an El Niño.

The take home from all this is that El Niño is currently solidifying and will favor a wet and cool spring in much of the southwestern U.S.  If it continues to strengthen into the summer, the odds for a second El Niño winter in 2019-20 are better than 50%.
Share on facebook
Share on google
Share on twitter
Share on linkedin
Share on pinterest

Drought Trends for March 21, 2019

Drought Trends for March 21, 2019

The large winter storm that hit the much of the country last week saw some pretty extreme impacts due to heavy winds and rain, snow, tornadoes, and of course massive flooding in the Midwest.  A large area in the South, however, from South Texas eastward, missed out on most of the precipitation and conditions continue to dry.

Over the last week, drought has continued to decrease in area.  Colorado and Wyoming observed large areas decreases, while the Texas Panhandle also saw a relatively large decrease.

Cattle in Drought
0 %
Hay in Drought
0 %

The percentage of corn, cattle, and hay that are considered in drought continues to decline.  This week finds 2% of cattle, 2% of hay, and 0% of corn in drought.  These are the lowest totals for all three since these stats started to be tracked in 2011.

Interactive chart showing cattle, hay, and corn areas in drought since 2011. The data are ranked from highest to lowest in drought. Mouse over the chart to see individual years.

Plot 40
Share on facebook
Share on google
Share on twitter
Share on linkedin
Share on pinterest

By the Numbers for the Week of March 14, 2019

By the Numbers

By the Numbers for the Week of March 14, 2019

  • 4% cattle, 3% hay, 0% corn

    The percentage of major cattle, hay and corn areas listed as being in drought, based on the U.S. Drought Monitor. The percentages are one of the lowest since these stats started to be tracked in 2011..

  • 1997-1998 El Niño

    The wettest winter on record with an average of 8.99” of precipitation for the contiguous U.S. That is, until this year. The 2018-2019 clocked in with an average of 9.0” of moisture just beating out the mega El Niño of the late 90’s.

  • 7 days of mostly dry & colder than average weather

    The next week (thru March 22) should be relatively dry for much of the country. This is a welcome relief for those caught in the Bomb Cyclone this week. Exceptions include parts of the Southwest (primarily southern Colorado, New Mexico, and down to Far West Texas), South Texas, western Kansas, and Florida. All of which could see above normal precipitation.

  • Zero drought

    California is now officially drought free for the first time since December 20, 2011. Until this week some part of the state had been in drought for 376 consecutive weeks. That beats Texas that saw a string of 276 weeks from May 2010 to July 2015 and Oklahoma, which observed 261 weeks in about the same time period between 2010 and 2015.

  • 49 counties in Kansas

    The number of counties in Kansas that have observed their top ten wettest winters on record. Mitchell and Washington Counties observed their wettest on record.

  • 3” of snow/hr and 30mph winds

    What some were reporting on Wednesday, March 14th, during the winter storm (aka Bomb Cyclone) that clobbered the Northern Plains. Many parts of the Dakotas observed their second or third coldest Februarys on record. Auction reports are seeing a decline in cattle condition and cattle feeders are seeing reduced performance. The intensity of this storm has certainly not helped as many or in the middle of calving. Send good thoughts up north, it has been a rough winter!

Share on facebook
Share on google
Share on twitter
Share on linkedin
Share on pinterest

By The Numbers For The Week Of March 4, 2019

By the Numbers

By The Numbers For The Week Of March 4, 2019

  • 200 head

    The number of head of cattle that have died in Missouri from nitrate poisoning in February. High nitrate levels are due to a complex interaction of too much precipitation, then not enough of it. Nitrate levels start to accumulate in the plant stems when growth is halted due to poor rainfall. Too much nitrate can become toxic (Successful Farming).

  • 2nd coldest and warmest

    February was the 2nd coldest on record for Montana and the 2nd warmest on record for Florida.

  • 20% in drought

    The amount of land area in Texas that is considered in Moderate Drought by the U.S. Drought Monitor. Moderate Drought is the lowest drought category so no need for alarm but it something we should be aware of. At the beginning of December 2018, almost no part of the state was considered in drought. Oklahoma only has about 1% of its area in drought.

  • 0.05” of moisture

    Amount of precipitation Lubbock has received since January 1st. That’s less than 25% of what normally would be expected for this time of year.

  • 1” in a week

    The amount of precipitation Lubbock is expected to get over the next 7 days.

  • 116th wettest

    The 2018-2019 Winter (Dec-Feb) was the 116th (out of 124 years) wettest winter on record for Oklahoma. Not to be outdone, Tennessee enjoyed its wettest winter ever! Texas observed its 86th wettest winter. All told, it was the wettest winter on record for the contiguous United States.

  • Dos, as in the number 2 in Spanish

    The number of years we could see the current El Niño event. NOAA and several other forecasters are starting to think we could see El Niño into the fall of 2019 and possibly beyond. Over the last four weeks, sea surface temperature conditions have strengthened and as a result there is a good chance we could ride this event for another year. It’s not unheard of for two years of El Niño, but an El Niño that is intensifying this late in winter/spring is unique. Hang on to your hats, this could be an interesting year!

Share on facebook
Share on google
Share on twitter
Share on linkedin
Share on pinterest