Drought Trends for May 7, 2019: Texas Drought Free
- Chad McNutt
- May 9, 2019
- 12:00 pm
[Excerpt from the May 7th U.S. Drought Monitor]
A large portion of the lower 48 states remains free of drought or abnormal dryness this week, including the entire Northeast and Midwest regions. Moderate drought coverage shifted in Georgia in response to precipitation patterns over the past week. Areas of short-term moderate drought were removed in Texas, where widespread moderate to heavy precipitation fell [NOTE this is the first time Texas has been drought free since July 2016].
Severe drought in northwest New Mexico was reduced in coverage because of improved short-term conditions, though some long-term precipitation deficits remain in the area. Moderate drought was added in western Washington because of worsening short- and long-term precipitation deficits and low streamflow.
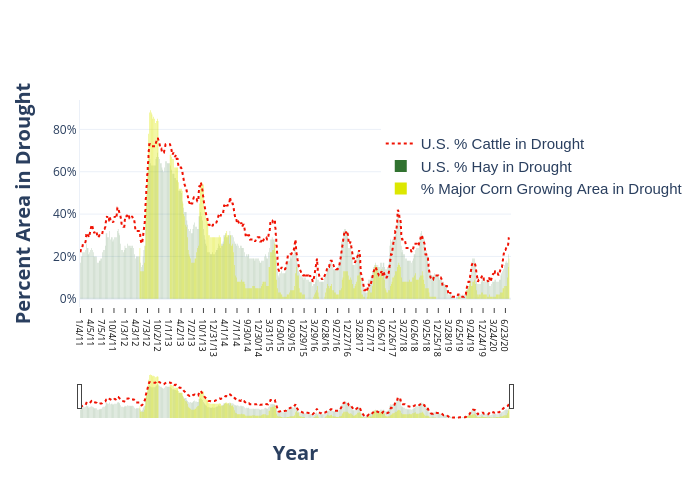
The percentage of cattle, corn, and hay in drought continues to remain low at 1% cattle, 1% hay, and no corn areas considered in drought.
1% Cattle in Drought

1% Hay in Drought

Most recent (May 7th) U.S. Drought Monitor showing areas in Abnormally Dry (yellow) or Drought (orange). Counties in blue have 50K head of cattle or great, while counties in green produce 40K tons of hay or greater.
Interactive chart showing cattle, hay, and corn areas in drought since 2011. The data are ranked from highest to lowest in drought. Mouse over the chart to see individual years.
Potential Areas of Drought Improvement and Deterioration
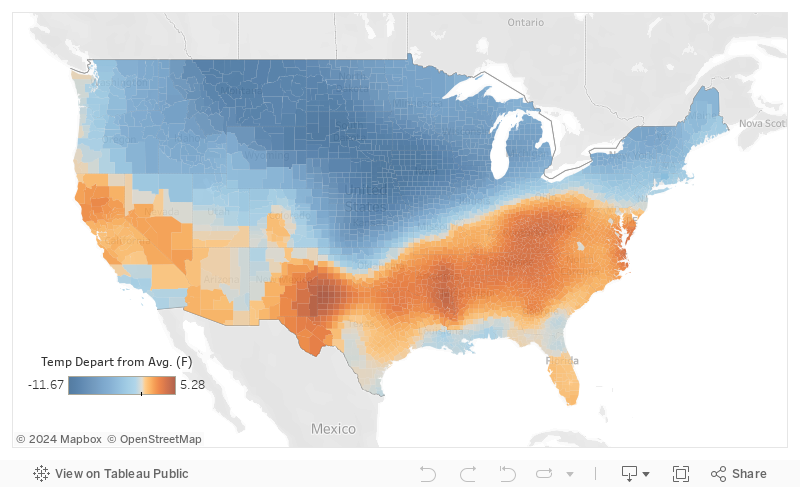
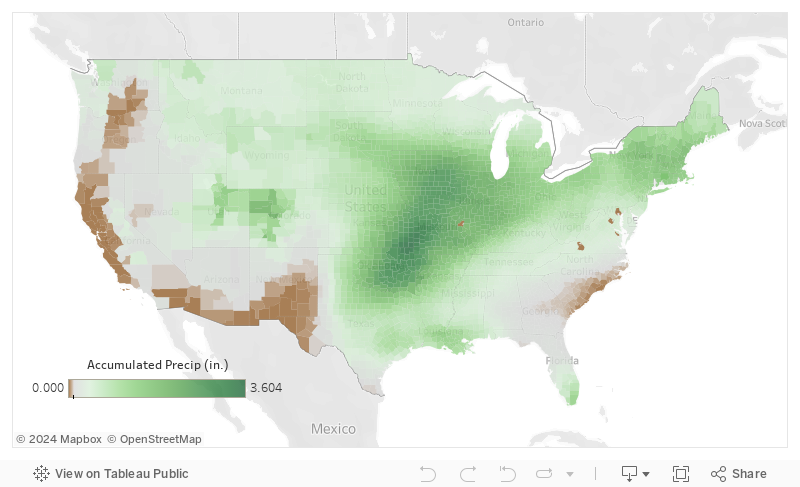
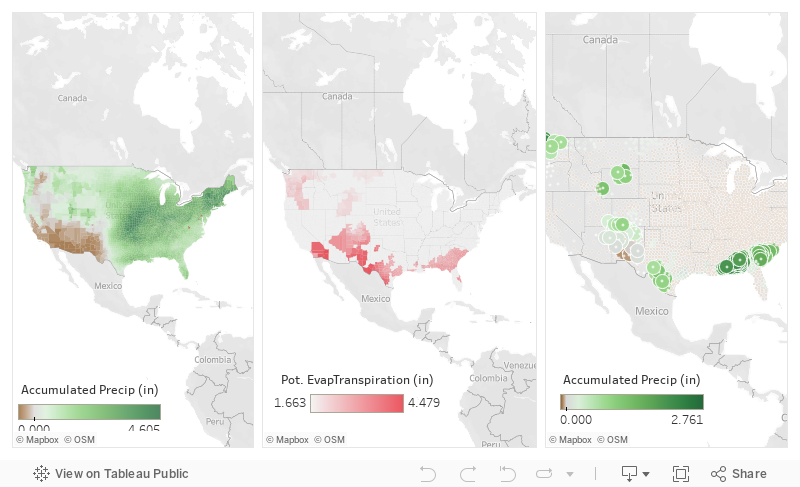
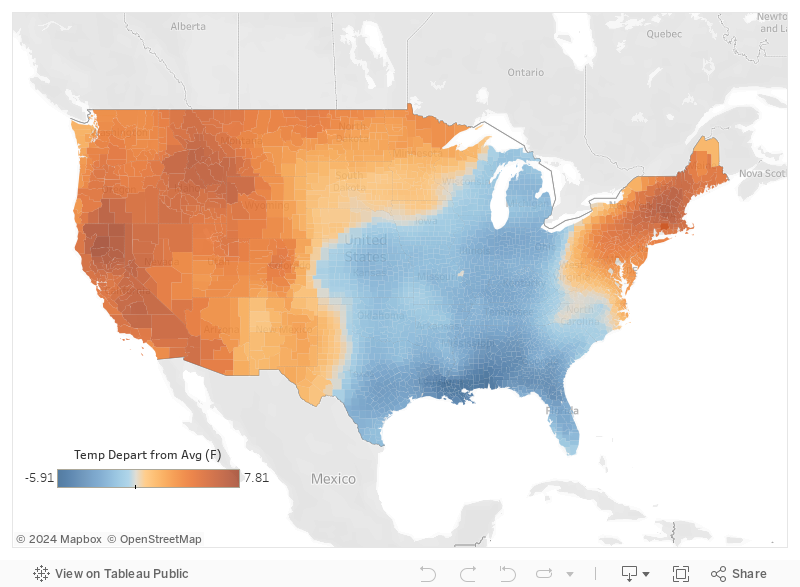
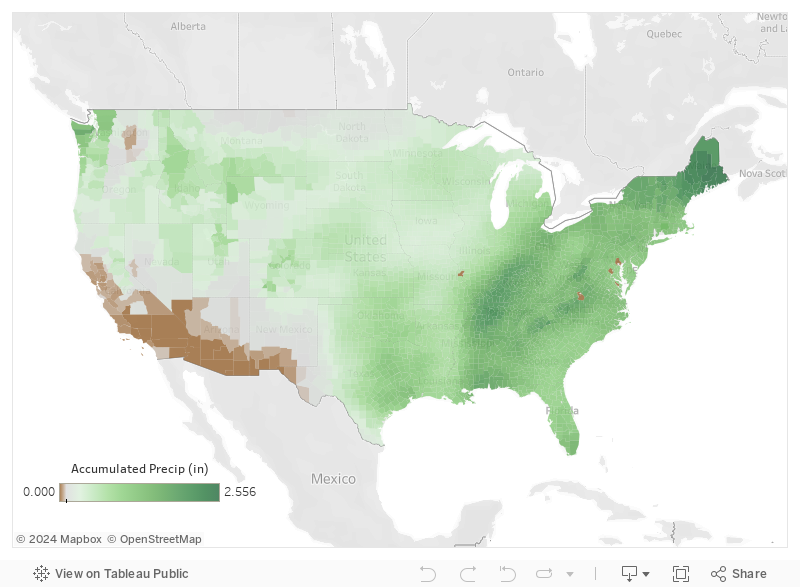
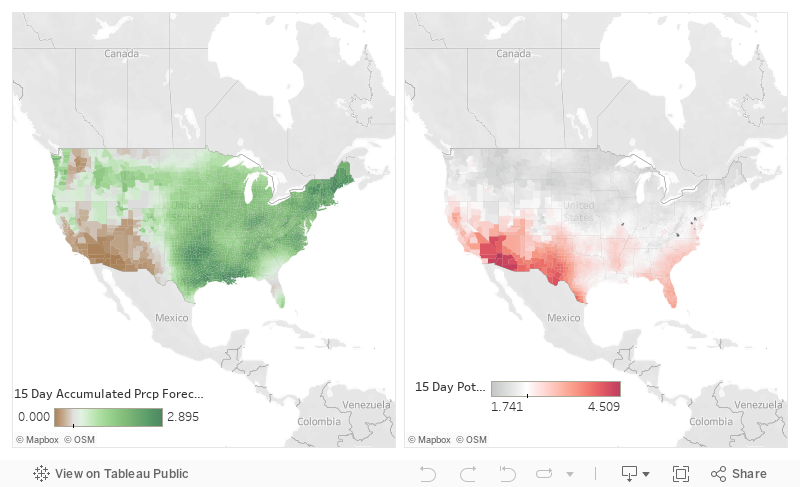
The below images show the U.S. Drought Monitor from May 7th and the 15-Day Accumulated Precipitation, Temperature Anomaly and the 15-Day Potential Evapotranspiration Forecasts. Potential Evaportranspiration, or PET, is the amount of evaporation that would occur if sufficient water is available. Basically, you can think about it as the amount of water that could be evaporated from the soils and plants (if water was not limited, which is why it has “Potential” in the title).
Widespread rain is forecast to continue over the next several days over parts of the south-central United States. The highest rainfall amounts are forecast to occur in southeast Texas and into Arkansas, and Louisiana. New Mexico should also see some decent moisture in areas that are still experiencing drought. Moderate precipitation amounts are predicted to fall across much of the Northeast and the Upper Midwest. Dry weather is forecast in the Pacific Northwest. Primarily warm weather is forecast in the Northwest, while much of the Plains is expected to be cooler than normal, with moderating temperatures expected early next week.
We should continue to see very minor drought for most of the U.S. The exception being the Pacific Northwest. Most other areas where drought still persist should continue to decline over the next 15-days.
May 7th U.S. Drought Monitor
Counties shaded in purple have cattle densities of 50K head or more. The percentage of the Contiguous U.S. continues to stay extremely low. At present 2.5% remains in drought.
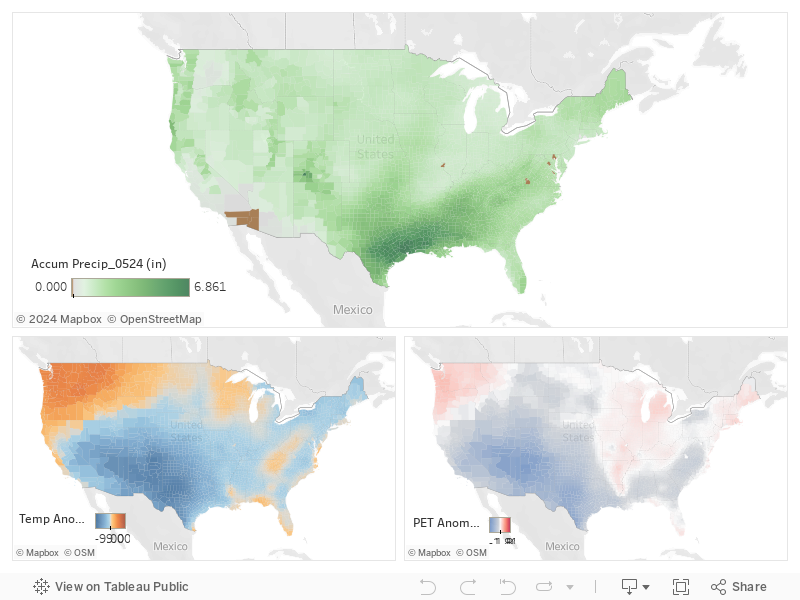
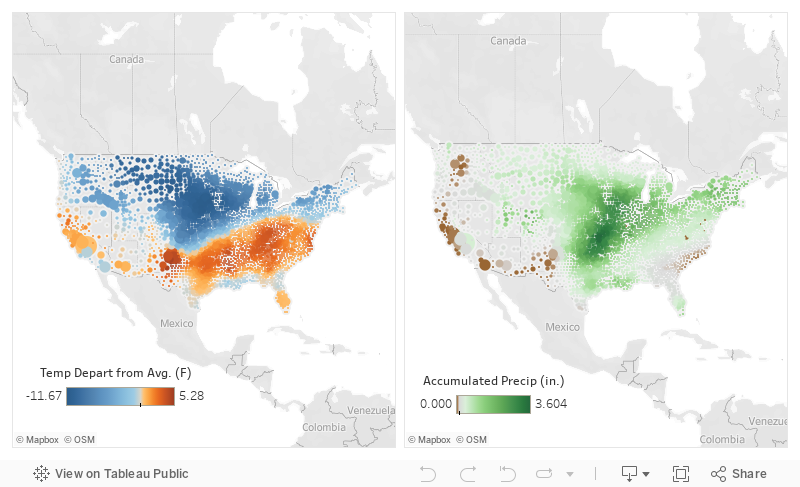
Precipitation and Temperature Forecasts
15-Day accumulated precipitation forecast (green/brown) and the Temperature Anomaly (orange/blue) compared to the 15-Day Potential Evapotranspiration Forecast (red/blue-gray) for the period of May 10 – May 24. Use your mouse to see data for individual counties.