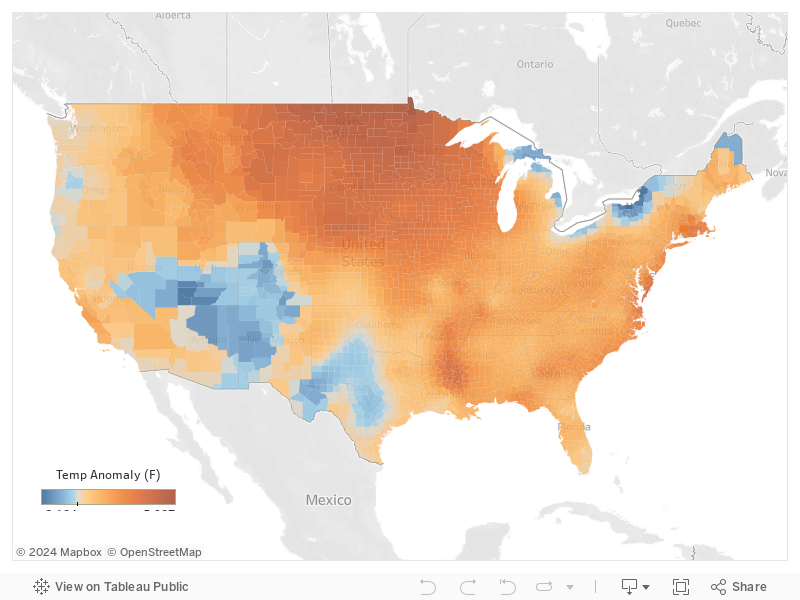
Above-normal temperatures are most likely over most of the East Coast, parts of the Midwest, and the Northern Plains. Parts of of California and western Arizona will also likely see above-normal temperatures.
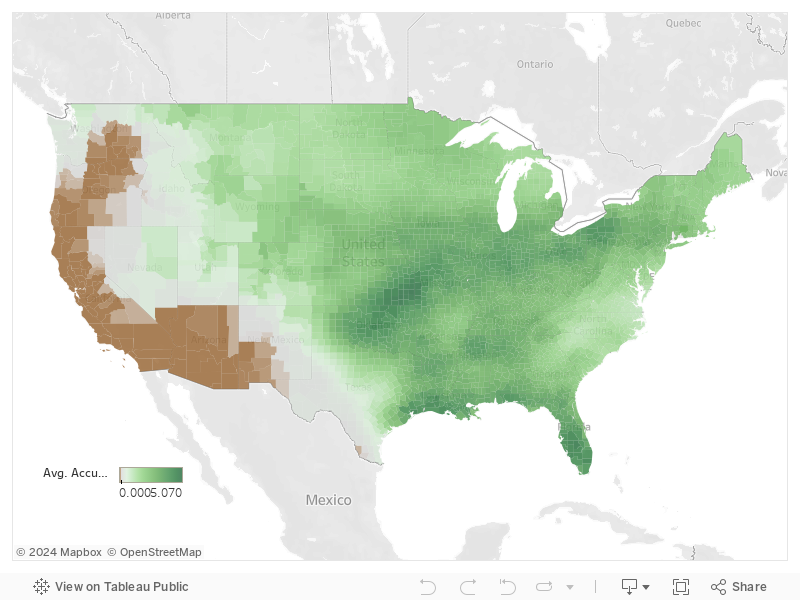
15-Day Accumulated Precipitation (in) Forecast
Southerly moisture flow over the next 6-10 days from the Tropics could lead to above-normal precipitation over parts of the Great Plains, the Central and Lower Mississippi Valley, the Ohio and Tennessee Valleys, and the Southeast. Enhanced probabilities of below normal precipitation are indicated on the west side of a predicted trough from the eastern Great Lakes region into the Northeast.
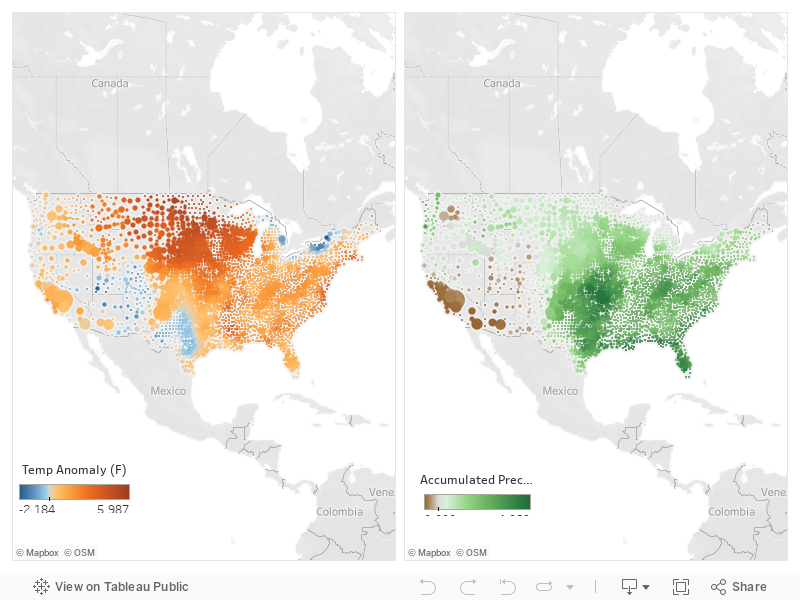
CATTLE DENSITIES & the 15-Day Temperature and Precipitation Forecasts
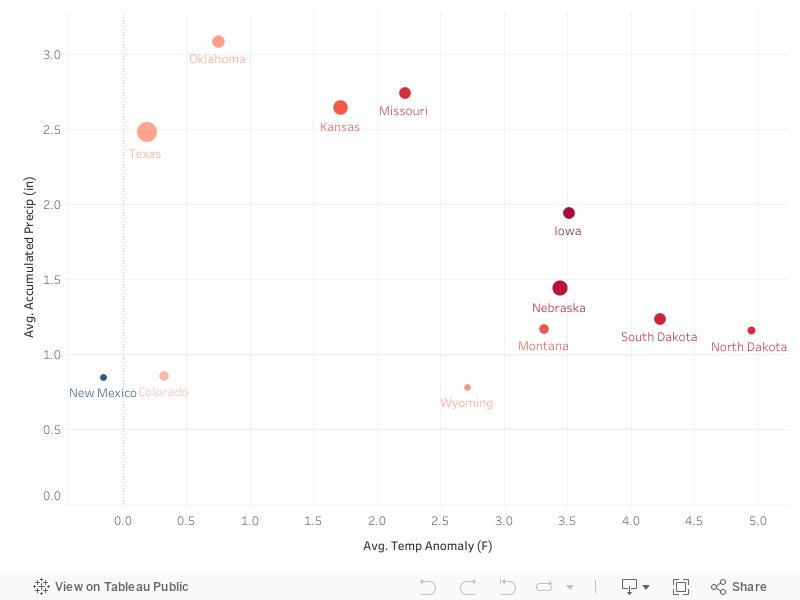
15-Day Temp-Precip Forecast for the 12 Major Feeder Cattle-Producing States
With the exception of New Mexico, the major feeder cattle-producing states will see state-wide temperatures above normal normal over the next couple of weeks. ND and SD will see the largest departures of four-degrees (F). TX, OK, KS, and MO will see statewide average rainfall accumulations of 2″ or more of rainfall.
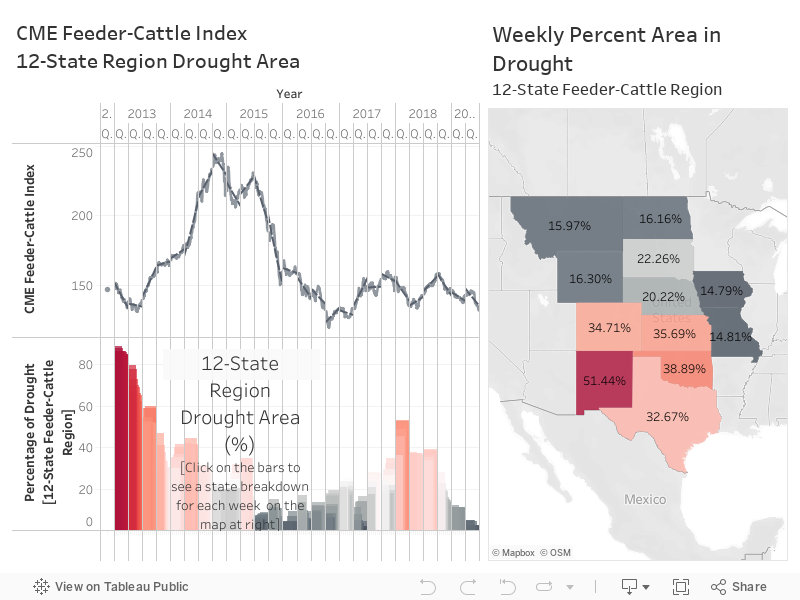
Drought & CME Feeder-Cattle Index
This week we have a new analytic that shows the CME Feeder-Cattle Index against the percentage of drought based on the U.S. Drought Monitor across the 12-State Feeder-Cattle region. The data in the below chart go from 2013-present. The CME Feeder-Index shows the 7-day weighted average price (cwt).
You can interact with the chart by using your mouse to see the data for specific dates. Click on the bars to see a breakdown of the 12-states on the map at right.
There are of course many things that can influence the Feeder-Cattle Index and drought is just one of them. We don’t necessarily see a trend (other than following the massive drought in the Southern Plains from 2011-2015) but we thought it was still interesting to see the data and play around with the chart. Hope you enjoy it too!
The percentage increase in corn futures from early May and to present. Futures have been trading between $3.50 to $4 per bushel for several years, however, flooding in the Corn Belt has raised concerns about poor yields and lost corn acres. December corn futures have gone from $3.72 in early May to $4.35 as of May 29. [Capital Press]
28 head
“I’ve stayed awake at night worrying about them cows down there because I knew some of them were still alive, and there was no way to get them.” Larry Washom, a rancher in Oklahoma, discussing the 28 head of cattle he lost in the recent Oklahoma flooding. We feel for you Mr. Washom. Parts of central and northeast Oklahoma have received close to 20” of rainfall over the last 30-days. The 30-Day Rainfall Accumulation map from the Oklahoma Mesonet tells the story. [quote from News on 6 in Tulsa, OK]
7-day rainfall forecast: good news and bad news
The persistent Southwest jet stream that produced the widespread severe weather and heavy rain is finally shifting. This shift in the jet stream should help reduce rainfall over the Upper Mississippi — at least over the next week, which should help the major flooding in the Mississippi, the Lower Missouri, and Arkansas River Basins. Parts of Texas, Oklahoma, Kansas, Arkansas, and Louisiana, however, could continue to receive very heavy rain and a high risk for flooding. Models are showing the focus for the heaviest rain over the next week could persist over the South-Central U.S.
90-degree days…an interesting number
The impending heat of summer means the start of 90-degree days for some; for others like Texas and Oklahoma and parts of the Southeast, it’s the continuation of the heat that’s already started. Although June 21 is considered by many to be the start of summer (with the occurrence of the summer solstice), meteorologists and climatologists consider the beginning of June to be the beginning of summer. Why is that you might be asking? Well, the first of June is when you start seeing those 90-degree days start to pop up across the country. Why is that important? 90-degrees is a pretty important metric for determining how “hot” a location is. At 90-degrees, you can start seeing things like heat-stress to vegetation, people and animals. If you would like to see how this works out and for who, we have provided a couple of maps. One that shows the places that first see 90-degree days in June and those that get to enjoy hot temperatures before everyone else. You probably can guess where they are. There is a pretty nice line around Interstate-10 from southern California all the way to Florida, showing the many places that have observed more than ten 90-degree days. Some of these hot days have even extended north into the High Plains and the Midwest. While this is very exciting for us here at Livestock Wx to think about, there is probably a fine line between painful elaboration of the obvious and interesting weather and climate stats. Sometimes we might cross that line
The impending heat of summer means the start of 90° days for some; for others it’s the continuation of the heat that’s already started. Let’s take a closer look at where we see those 90° temperatures – up until now, and into the first month of summer (June).
Although June 21 is considered by many to be the start of summer (with the occurrence of the summer solstice), meteorologists and climatologists consider the beginning of June to be the beginning of summer. A closer look at the climatological data, and you might be able to figure out why.
Average maximum temperatures in June are largely between 70° and 90° for most of the country (maroon dots). For the desert southwest, most of Texas, and the southeast, average maximum temperatures are mostly over 90° (pink dots). For isolated locations in the north, the Pacific Northwest, and some high elevation locations of the Rockies, average June maximum temperatures stay below 70° (yellow dots). Looking at this map, it seems it could be a useful tool in helping those in the south know where to go to cool off for the summer!
Despite the fact that most of the country averages temperatures below 90° in June, many of these locations will actually see their first 90° day in – you guessed it – June. Check out this map that shows stations that typically observe their first 90° day in June. Pretty much all of the locations that don’t average temperatures above 90° will still see a 90° day this month.
While a lot of these areas in gray are anticipating their first really hot day of the year, there are other areas that have already become familiar with the heat. This last map shows the number of 90° days already experienced across the country. Not surprising that most of the regions that average very hot temperatures in June have already seen several 90° days before the official start of summer. Following a line around Interstate-10 from southern CA all the way to Florida, many stations have observed more than ten 90° days. Some of these hot days have even extended north into the High Plains and the Midwest.
90° is a pretty important metric for determining how “hot” a location is. At 90°, vegetation begins to show signs of stress. It’s widely considered fact that the growth of some crops is inhibited during these hotter days. When the temperature tops out above 90°, heat stress is also more common for people and animals. Over the last couple of decades, summer trends have seen an increasing number of these very warm temperatures. For example, in Colby, Kansas, average number of 90° days has increased from around 50 in the 1970s to around 60 in the 2010s. On a positive note, thanks to increased irrigation through many areas of the High Plains, the number of 90° days has actually decreased (take Seward, Nebraska for example). Still, it’s safe to assume that we’ll have a number of uncomfortable days ahead of us as we head into summer. Be prepared, and find ways to help your family (and your livestock!) keep cool on those particularly hot summer days.
Share on facebook
Share on google
Share on twitter
Share on linkedin
Share on pinterest
Becky Bolinger
Dr. Bolinger is the Colorado Assistant State Climatologist. She is based at Colorado State University and is a frequent contributor to Livestock Wx, the U.S. Drought Monitor and tracks all things climate around Colorado.