By the N#mbers for the Week of May 6, 2019: Rain Just Keeps Coming

By the N#mbers for the Week of May 6, 2019: Rain Just Keeps Coming

$1 billion in damages with lost cattle and property damage

The amount of damage caused by natural disasters this winter and spring in Nebraska. It’s an understatement to say it’s been a difficult winter and spring for cattle producers there. To show support for cattle producers Governor Pete Ricketts declared May as Beef Month in Nebraska. [The Grand Island Independent]

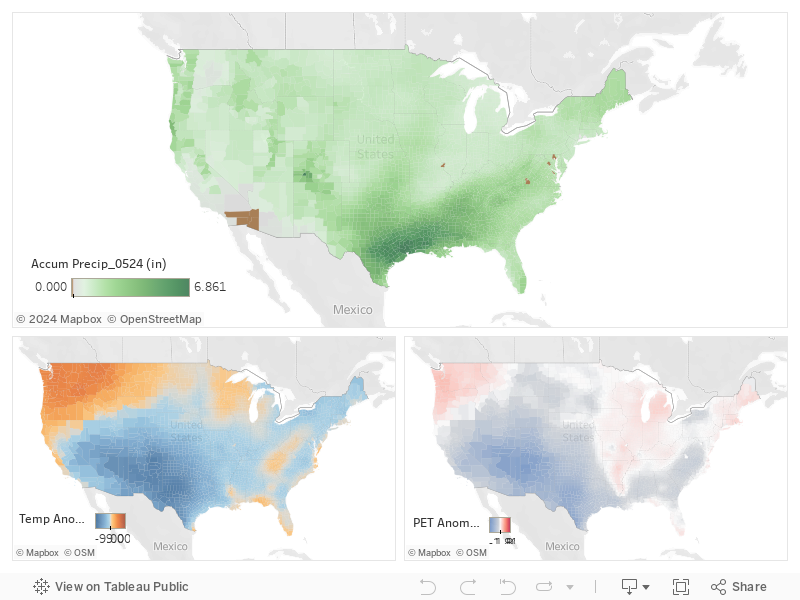
6” rainfall last 7-days…..5” rainfall over the next 7

The amount of rainfall Atoka, Pushmataha, Coal, and Johnston Counties in Southeast Oklahoma received over the last week and the amount they are expected to get over the next week. If you’re counting that could be 11-12” or more of precipitation in two weeks. The average precipitation for April and May is about 11”. That shouldn’t be a problem.

51 days since significant rainfall has fallen

With all this rainfall could anyone be dry? Well, the folks out in The Texas/Oklahoma Panhandle could answer that question. It has been 51 days since parts of Texas and Cimarron Counties in Oklahoma have received a quarter inch or more of rainfall. Over the next week this streak could be broken as the Panhandle could see a half-inch or more of rainfall. Fingers crossed.

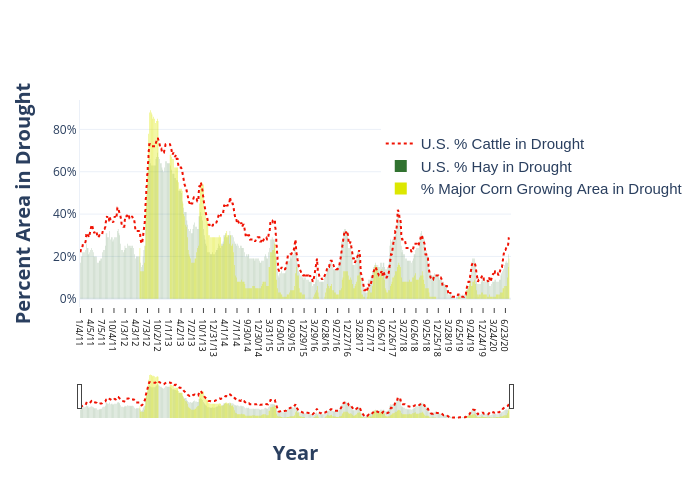
15 percent of the corn crop had been planted by April 28

The five-year average is 27%. Extremely wet soils and continued precipitation has caused planting delays across the Corn Belt. The period between September 2018 and March 2019 has been the wettest 7-month period for the Midwest on record. The 7-day Accumulated Precipitation Forecast for the Midwest is not helping the situation and will likely delay planting to mid-May. If conditions don’t improve, we could see a reduction in acres plated or lower yields. [Reuters]

Share on facebook
Share on google
Share on twitter
Share on linkedin
Share on pinterest

The Surprising Frequency of Deadly Spring Snowstorms

Most of us who live in the Upper Midwest and High Plains already know that, even after spring has started, there is still a risk for winter to rear its ugly head again. But how often do significant snowfall events happen in April and May?

In mid-April, another powerful storm system made its way across the plains, bringing strong winds, snow, and blizzard conditions from areas just east of the Rockies all the way to the Great Lakes and Ohio River valley. According to NOAA’s National Centers for Environmental Information, three different stations in South Dakota broke their daily snowfall records for April 10. While snow in April may have sounded surprising to some, this is not the first time a large April storm has blanketed the plains in white.

Snowfall analysis of the April 2013 storm that hit the Northern Plains

Consider this example, back in April 2013, areas in Montana, Wyoming, Colorado, and east through the Dakotas, Nebraska, and into Minnesota received between 2-10″ from the 15th to the 18th. Several other springtime examples have brought devastation to livestock producers.  Most remember 1997 and the early April blizzard in North Dakota that hit in the middle of calving.  The storm killed an estimated 100 thousand head of cattle, most of those being calves and yearlings.  In 1966, a March storm hit a similar area in North Dakota and Minnesota.  That storm unleashed 70mph winds and resulted in drifts of 30 to 40 feet killing approximately 20 thousand head of cattle.

Average April high temperatures across the north and High Plains typically reach above 50°F. But it’s still quite easy for troughs of strong low pressure to pass through the region and bring temperatures down to well below freezing. Consider Scottsbluff, Nebraska, where average high temperatures are over 60°F after April 10, and average low temperatures warm up above freezing by April 19. And yet, each year, Scottsbluff sees colder than freezing temperatures an average of 5-10 days from mid-April through May.

Average amount of snowfall for the Plains in April and May

According to data from the Midwestern Regional Climate Center, long-term average snowfall after April 15 totals more than an inch along the Colorado Front Range, throughout most of Wyoming and Montana, and across the Dakotas. Snow in late spring is a given.

One to two inches of snow in the spring isn’t really associated with major impacts. But crops and livestock can be sensitive to a larger accumulating event. The Midwestern Regional Climate Center has an archive of Snow Climatology Maps, where a user can look up averages and different snow statistics across the country for every month of the year.

Even in May, the risk of large accumulating snowfall events still exists. Some stations in the Midwest have seen 6” of snowfall at least once in May. A few locations in the Dakotas, Montana and Wyoming have experienced between two and five days of 6” snowfall events in May.

What we’ve experienced this spring is a good reminder that spring doesn’t always mean thunderstorms, warmer temperatures, and blooming flowers. Snow, winds, blizzards, and cold temperatures can and do occur. Assessing your risk for these events, as well as paying close attention to the weather forecasts, can help you prepare and minimize the impacts.

Drought Trends for May 7, 2019: Texas Drought Free

Drought Trends for May 7, 2019: Texas Drought Free

[Excerpt from the May 7th U.S. Drought Monitor]

A large portion of the lower 48 states remains free of drought or abnormal dryness this week, including the entire Northeast and Midwest regions. Moderate drought coverage shifted in Georgia in response to precipitation patterns over the past week. Areas of short-term moderate drought were removed in Texas, where widespread moderate to heavy precipitation fell [NOTE this is the first time Texas has been drought free since July 2016].

Severe drought in northwest New Mexico was reduced in coverage because of improved short-term conditions, though some long-term precipitation deficits remain in the area. Moderate drought was added in western Washington because of worsening short- and long-term precipitation deficits and low streamflow.

The percentage of cattle, corn, and hay in drought continues to remain low at 1% cattle, 1% hay, and no corn areas considered in drought.

1% Cattle in Drought

1% Hay in Drought

Most recent (May 7th) U.S. Drought Monitor showing areas in Abnormally Dry (yellow) or Drought (orange).  Counties in blue have 50K head of cattle or great, while counties in green produce 40K tons of hay or greater.

Interactive chart showing cattle, hay, and corn areas in drought since 2011. The data are ranked from highest to lowest in drought. Mouse over the chart to see individual years.

Plot 40

Potential Areas of Drought Improvement and Deterioration

The below images show the U.S. Drought Monitor from May 7th and the 15-Day Accumulated Precipitation, Temperature Anomaly and the 15-Day Potential Evapotranspiration Forecasts.  Potential Evaportranspiration, or PET, is the amount of evaporation that would occur if sufficient water is available.  Basically, you can think about it as the amount of water that could be evaporated from the soils and plants (if water was not limited, which is why it has “Potential” in the title).

Widespread rain is forecast to continue over the next several days over parts of the south-central United States. The highest rainfall amounts are forecast to occur in southeast Texas and into Arkansas, and Louisiana. New Mexico should also see some decent moisture in areas that are still experiencing drought. Moderate precipitation amounts are predicted to fall across much of the Northeast and the Upper Midwest. Dry weather is forecast in the Pacific Northwest. Primarily warm weather is forecast in the Northwest, while much of the Plains is expected to be cooler than normal, with moderating temperatures expected early next week.

We should continue to see very minor drought for most of the U.S.  The exception being the Pacific Northwest.  Most other areas where drought still persist should continue to decline over the next 15-days.

May 7th U.S. Drought Monitor

Counties shaded in purple have cattle densities of 50K head or more. The percentage of the Contiguous U.S. continues to stay extremely low. At present 2.5% remains in drought.

Precipitation and Temperature Forecasts

15-Day accumulated precipitation forecast (green/brown) and the Temperature Anomaly (orange/blue) compared to the 15-Day Potential Evapotranspiration Forecast (red/blue-gray) for the period of May 10 – May 24. Use your mouse to see data for individual counties.

Share on facebook
Share on google
Share on twitter
Share on linkedin
Share on pinterest